Murrey Math Lines 11.12.2017 (EUR/USD, GBP/USD)
EUR USD, “Euro vs. US Dollar”
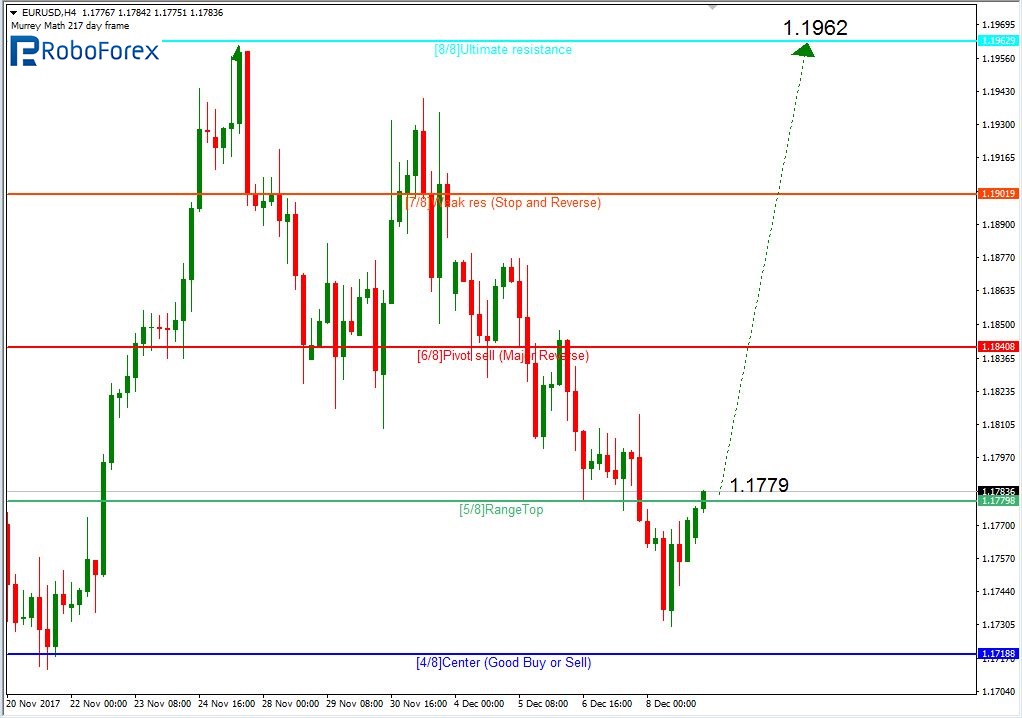
As we can see at the H4 chart, the EUR/USD pair is trading at the 5/8 level (1.1779). If later the price breaks this level to the upside, it may continue growing towards the resistance at the 8/8 one (1.1962).
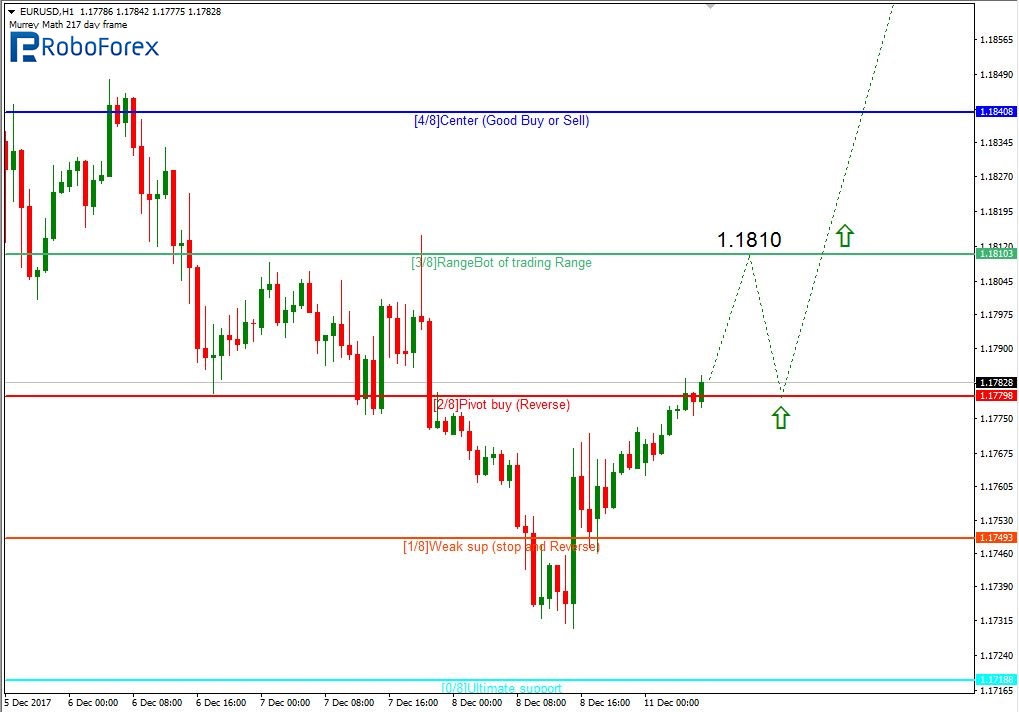
At the H1 chart, the price may grow to reach the resistance at the 3/8 level (1.1810) and rebound from it, and start a new correction. Later, the price is expected to return to this level and break it on the second try.
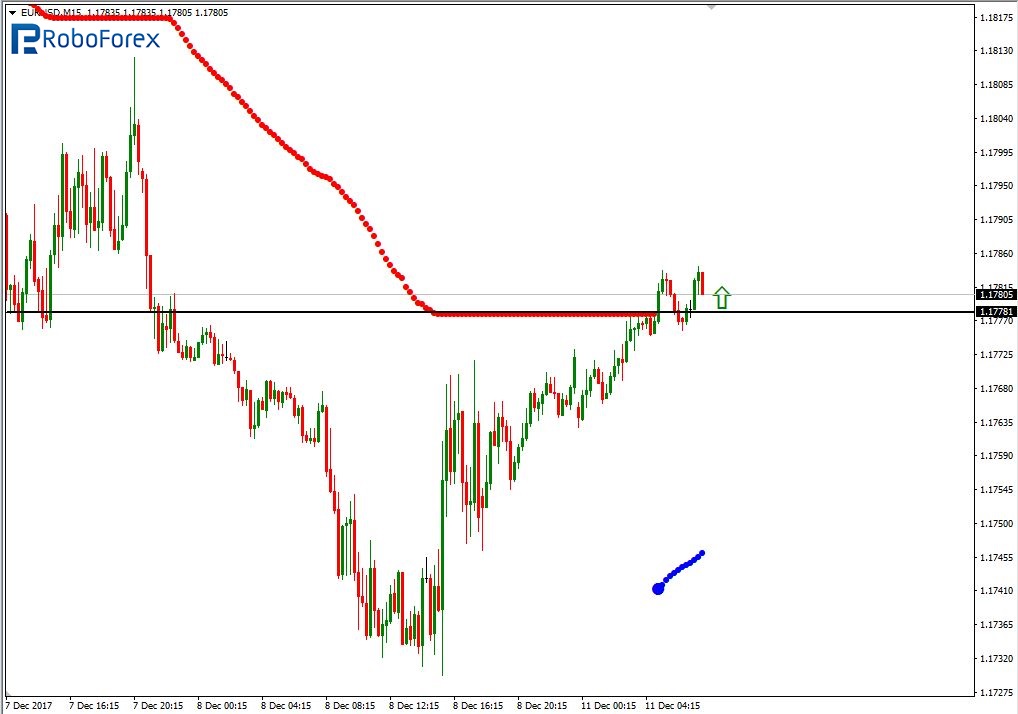
As we can see at the M15 chart, the pair has broken the upside line of the VoltyChannel indicator and, as a result, may continue trading to the upside.
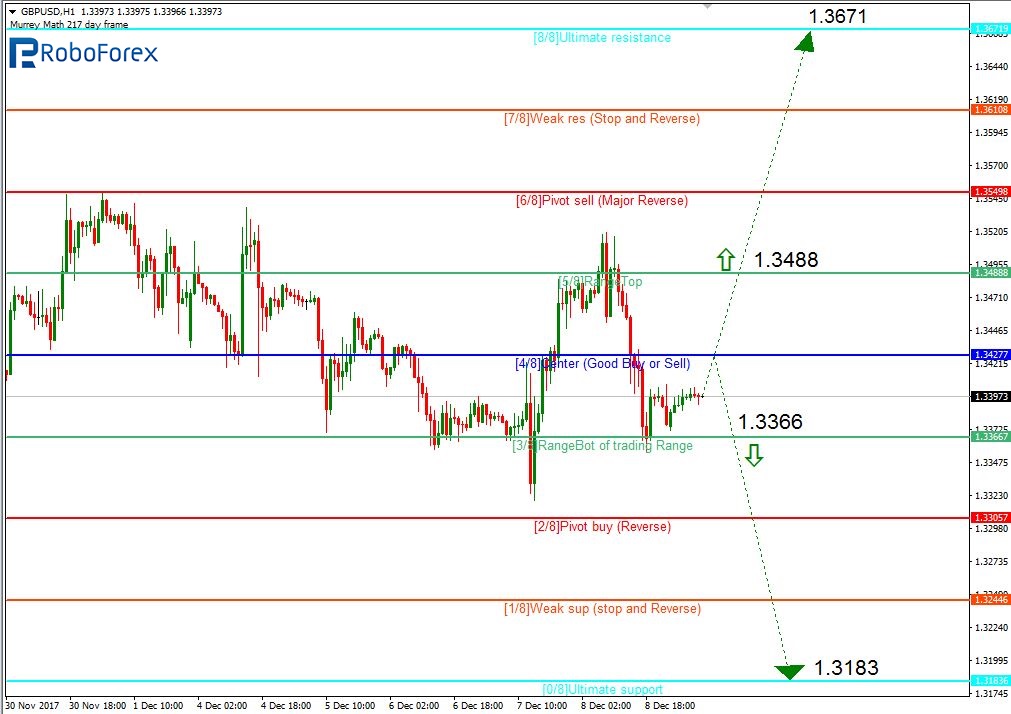
GBP USD, “Great Britain Pound vs US Dollar”
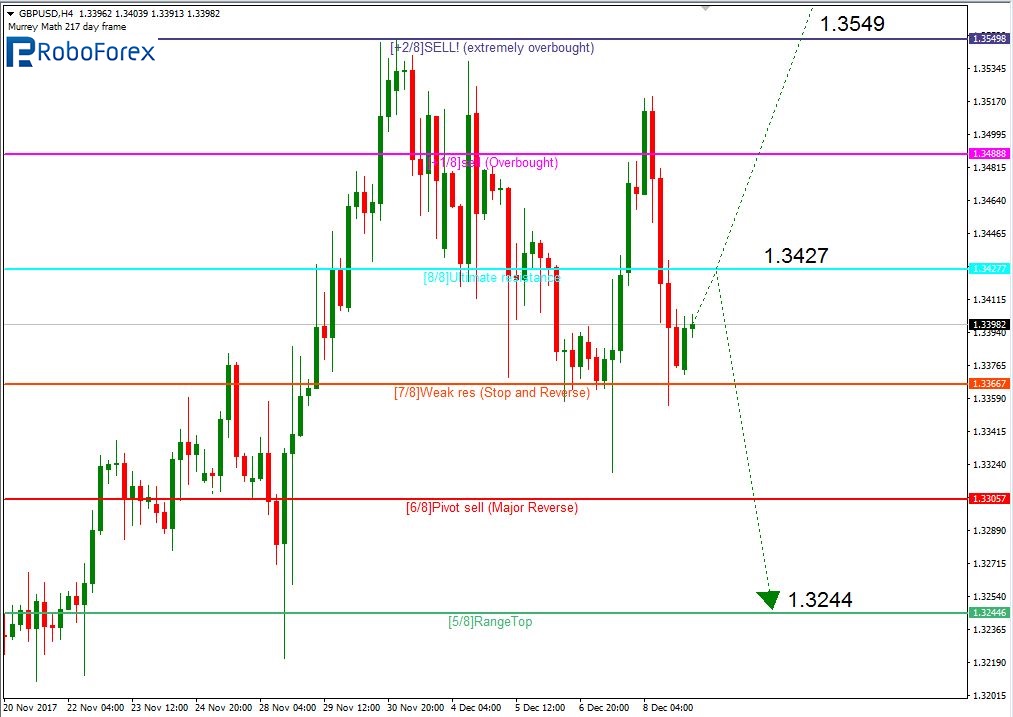
At the H4 chart, the GBP/USD pair is trading below resistance at the 8/8 level (1.3427). First of all, this means that the downtrend may continue and one may think of consider opening short positions from the 8/8 level. However, if the price breaks this level, the instrument will enter “the overbought zone” again and may continue growing towards the +2/8 one. If later the pair breaks this level, the lines at the chart will be redrawn and the price will continue moving upwards.
As we can see at the H1 chart, the price is consolidating between the 3/8 and 5/8 levels. The future scenario depends on which border of the range, upside or downside, the price breaks. If the price breaks the 5/8 level (1.3488), the instrument will continue growing with the target at the 8/8 one (1.3671); if the 3/8 level (1.3366) – move downwards to reach the support at the 0/8 one (1.3183).
RoboForex Analytical Department
Forecasts presented in this section only reflect the author’s private opinion and should not be considered as guidance for trading. RoboForex bears no responsibility for trading results based on trading recommendations described in these analytical reviews.