Fibonacci Retracements Analysis 14.01.2019 (GOLD, USDCHF)
XAUUSD, “Gold vs US Dollar”
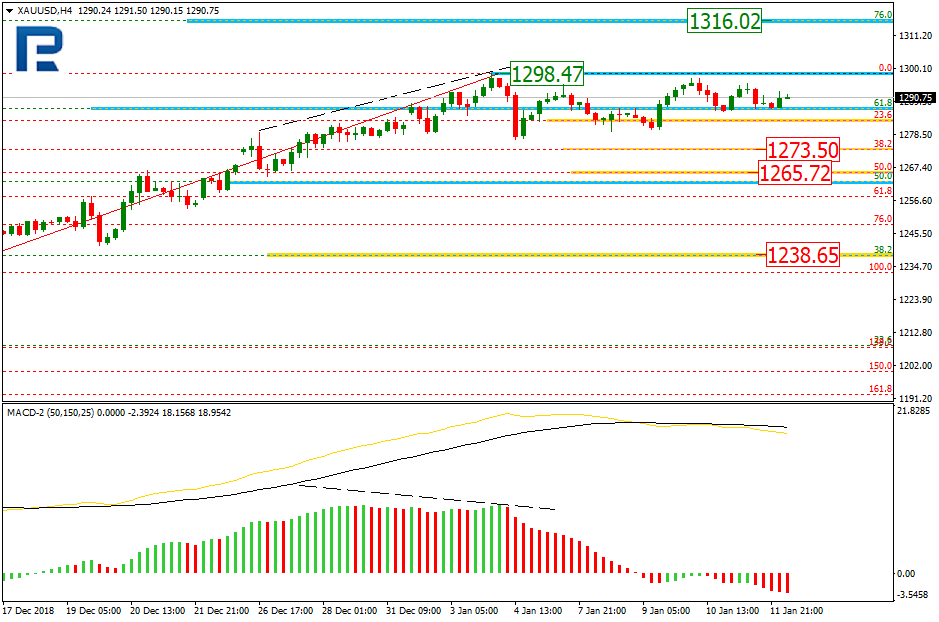
As we can see in the H4 chart, XAUUSD is being corrected sideways and may break the range both upwards and downwards. By now, the pair has been corrected to the downside by 23.6% and may continue trading towards the retracements of 38.2 and 50.0% at 1273.50 and 1265.72 respectively. However, if the price breaks the high at 1298.74, the instrument may resume growing to reach its mid-term target at 1316.02 (the retracement of 76.0%). The support level is at 1238.65.

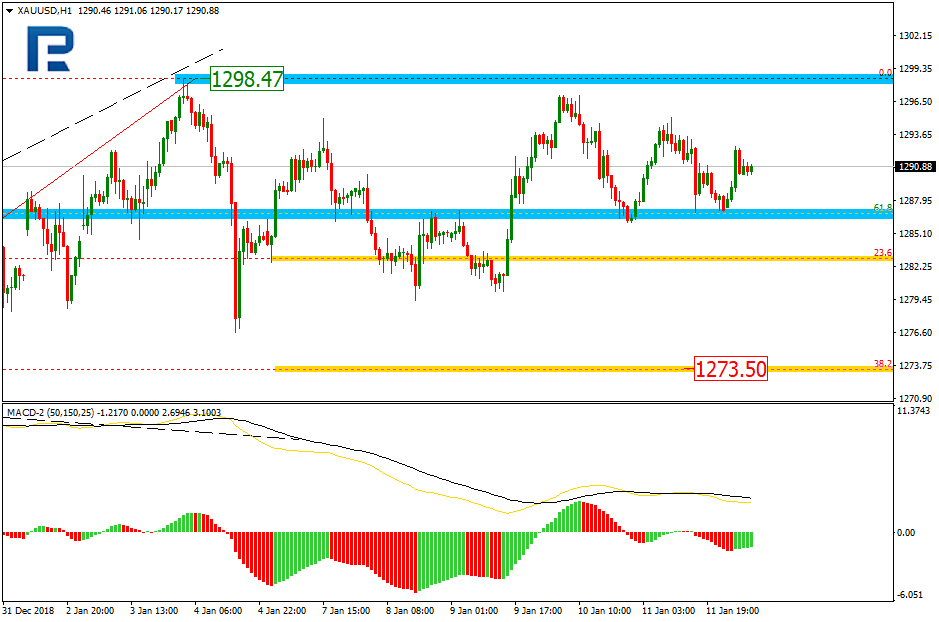
In the H1 chart, the pair is consolidate inside the convergent triangle range. In this case, there is a high possibility that the price may break the range to the upside.
USDCHF, “US Dollar vs Swiss Franc”
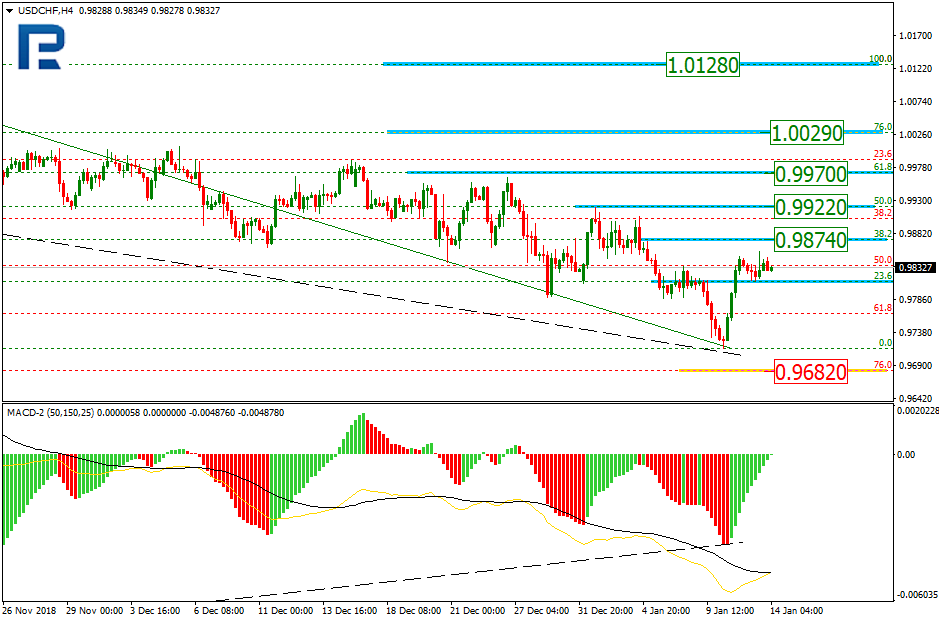
As we can see in the H4 chart, the correctional downtrend continues; USDCHF has already reached the retracement of 61.8%. At the same, time, there was a huge convergence on MACD, which may indicate a new impulse to the upside. The possible targets are the retracements of 38.2%, 50.0%, 61.8%, and 76.0% at 0.9874, 0.9922, 0.9977, and 1.0029 respectively. The key resistance level is the high at 1.0128.
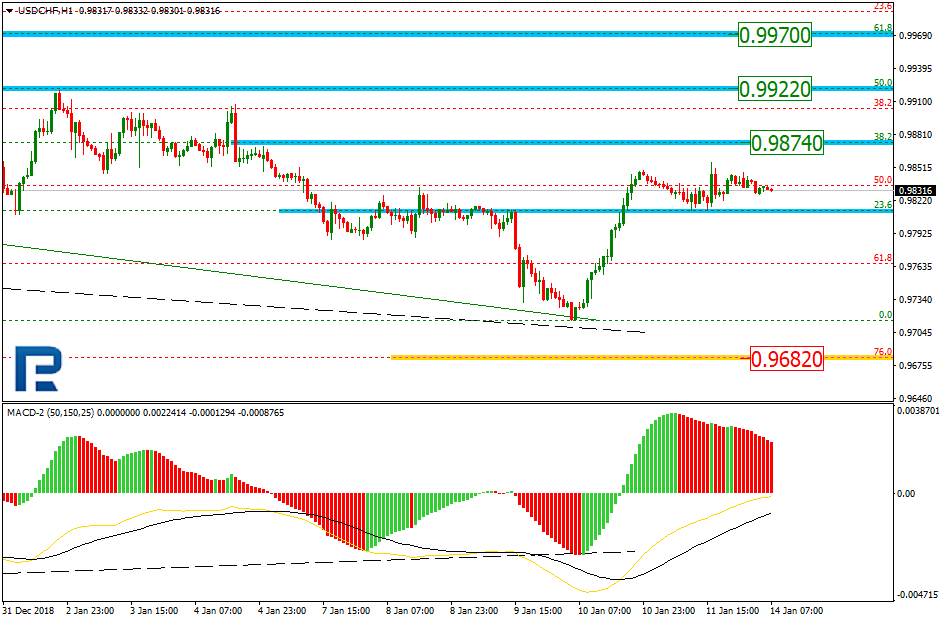
In the H1 chart, the pair has reached the retracement of 23.6% and right now is trading sideways.
Forecasts presented in this section only reflect the author’s private opinion and should not be considered as guidance for trading. RoboForex bears no responsibility for trading results based on trading recommendations described in these analytical reviews.