Bill Williams’ Indicators Analysis 26.06.2014 (USD/CAD, NZD/USD)
26.06.2014
Analysis for June 26th, 2014
USD CAD, “US Dollar vs Canadian Dollar”
At H4 chart of USDCAD, Alligator is going down, AO is in red zone, AC is near balance line, squat bar is visible on MFI. Bullish fractal can reach mouth of Alligator (green line), then I expect breakout of fractals to the downside.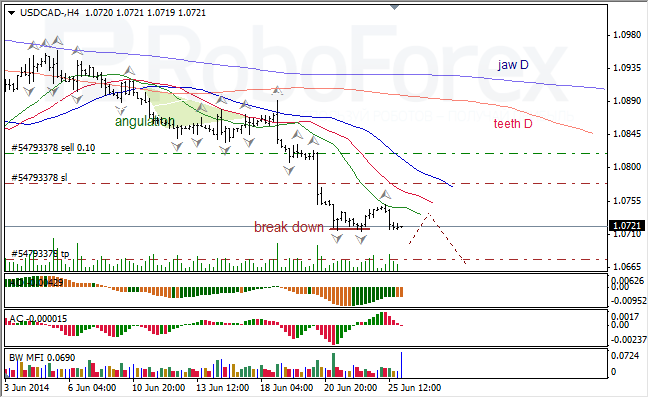
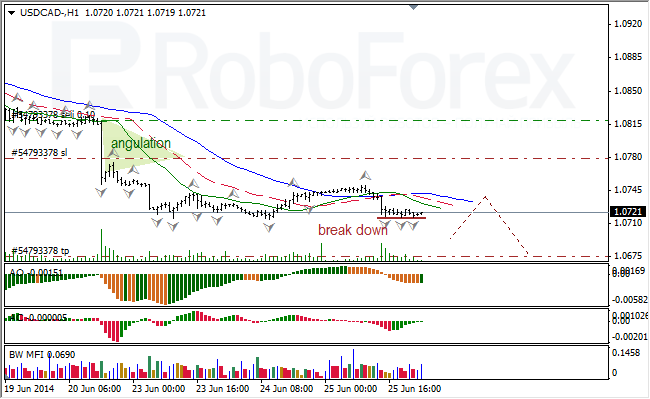
At H1 chart of USDCAD, Alligator is sleeping, AO is in green zone, AC is on the balance line, squat bar is visible on MFI. Bullish fractal can reach jaw of Alligator, after that I expect breakout of fractals to the downside.
NZD USD, “New Zealand Dollar vs US Dollar”
At H4 chart of NZDUSD, Alligator is ascending, indicators are in green zone, squat bar can appear of MFI. I expect breakout of fractals to the upside.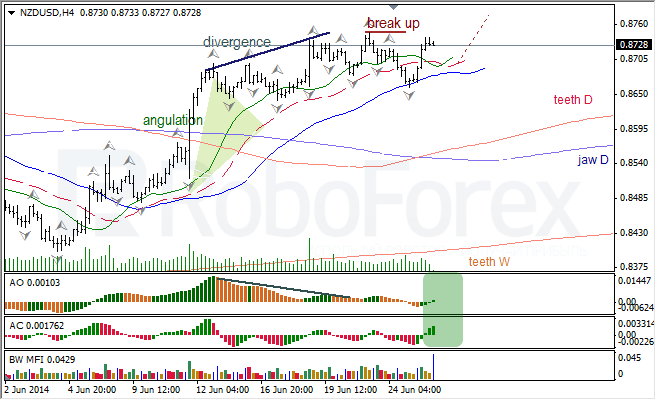
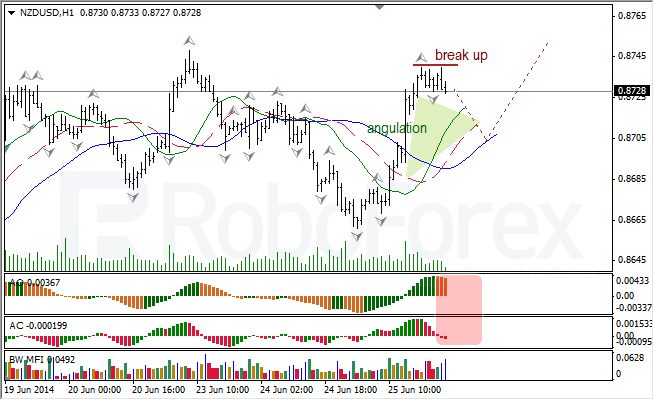
At H1 chart, Alligator is heading up, Angulation is opened, AO and AC are in red zone, squat bar is shown on MFI. Bearish fractal can close Angulation and reach jaw (blue line), then I expect breakout of fractals to the upside
RoboForex Analytical Department
Attention!
Forecasts presented in this section only reflect the author’s private opinion and should not be considered as guidance for trading. RoboForex bears no responsibility for trading results based on trading recommendations described in these analytical reviews.