Technical Analysis 26.07 (EUR/USD, GBP/USD, USD/CHF)
EUR/USD
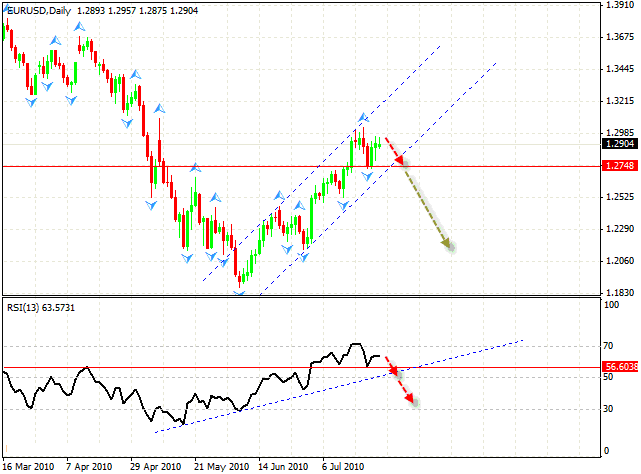
The daily chart of the EUR/USD currency pair tells us about the possibility of the trend reverse. At the RSI indicator we can see the formation of “Failure Swing” pattern,which can be regarded as a very strong signal to sell the pair, as it indicatesthat the prices are breaking the level of 1.2748.The pattern at the indicator looks similar to “head & shoulders” reversal pattern, the breaking of the neckline will lead to a significant fall of the indicator’s values and the price. One can try to sell the pair at short periods of time, with the tight stop, if possible.

GBP/USD
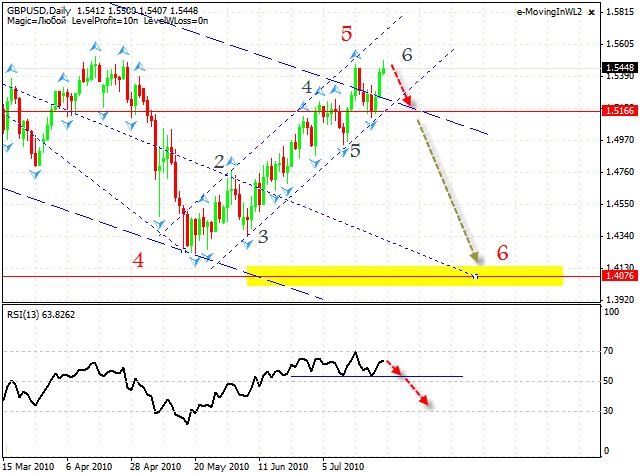
The RSI indicator shows us more defined pattern, which indicates that the level of 1.5166 has been broken. When the price leaves the rising channel, we should expect the rate to fall into the area of 1.4076.If the RSI forex online indicator goes up into the area of 70, it will lead to the situation when this case scenario will be cancelled. We should expect the rate to fall after the support level at the RSI indicator is broken.
USD/CHF
Franc has been very unpredictable lately. We have the rising pattern here, one can try to buy the pair with the target in the area of 1.0586. The stop must be hidden behind the closest minimum.

Forecasts presented in this section only reflect the author’s private opinion and should not be considered as guidance for trading. RoboForex bears no responsibility for trading results based on trading recommendations described in these analytical reviews.