Forex Technical Analysis 2011/30/06 (EUR/USD, GPB/USD, USD/CAD, OIL) Forecast FX
29.06.2011
Forecast for June 30th, 2011
EUR/USD
At the daily chart o the pair we can see the formation of the “triangle”, but it’s difficult to say when it will be broken. The main scenario is the price breaking the pattern downwards, towards the descending channel’s lower border. One can consider selling the EUR/USD currency pair near the “triangle’s” upper border with the stop outside it.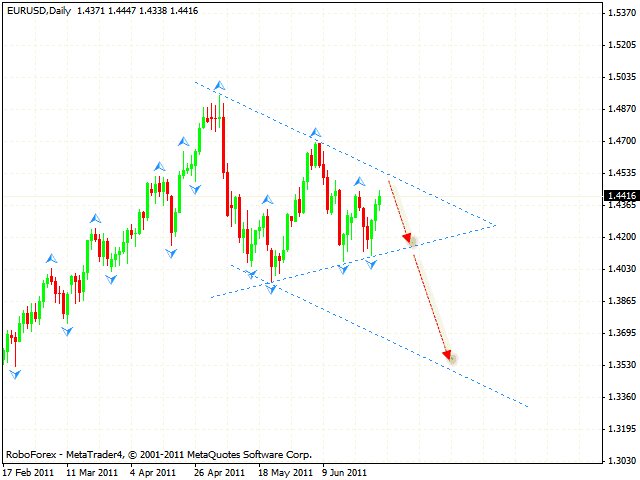
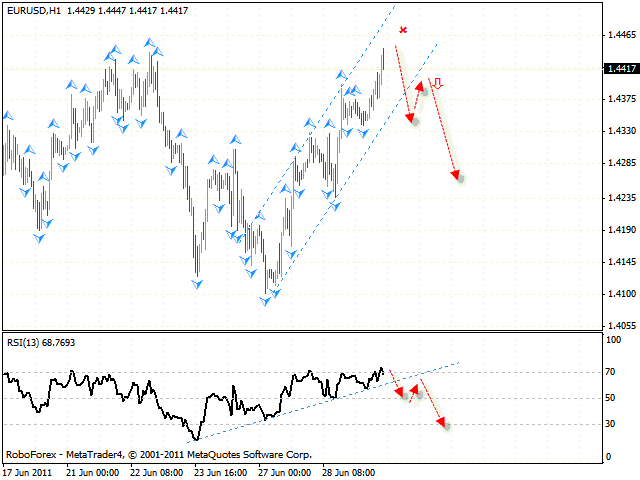
Judging by the hourly chart of the pair, one can consider selling the pair only after the price breaks the trend’s rising line at the RSI. Don’t forget to move stop into the black as soon as possible. The stop must be above local maximum.
GBP/USD
Pound is moving inside the descending channel with the target in the area of 1.5804. One can consider selling the pair either when the RSI indicator tests the descending channel’s upper border, or from the area of 1.6070. If the price breaks the descending channel and leaves it, this case scenario will be cancelled.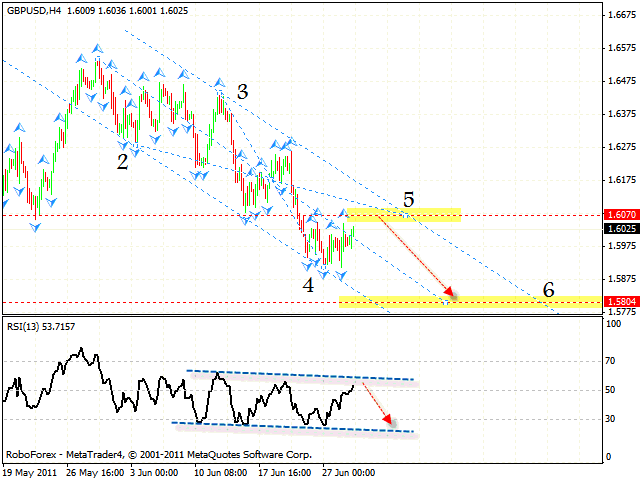
USD/CAD
Canadian Dollar has reached the rising channel’s lower border, one can try to buy the pair with the tight stop below 0.9690. The price testing the trend’s rising line at the RSI is an additional signal to buy the pair. The target of the growth is the area of 0.9915. If the price breaks the channel’s lower border, this case scenario will be cancelled.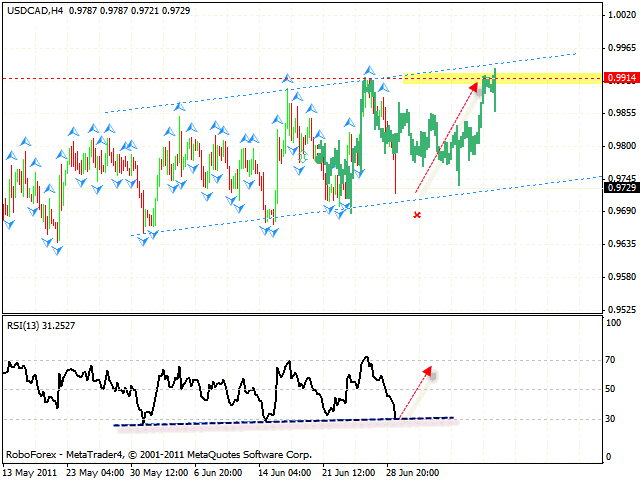
OIL
At the H4 chart of OIL there is a correction, and currently the price is testing the descending channel’s upper border. One can consider selling the instrument with the tight stop. But if the price leaves the descending channel, this case scenario will be cancelled. The target of the fall is the area of 88.70.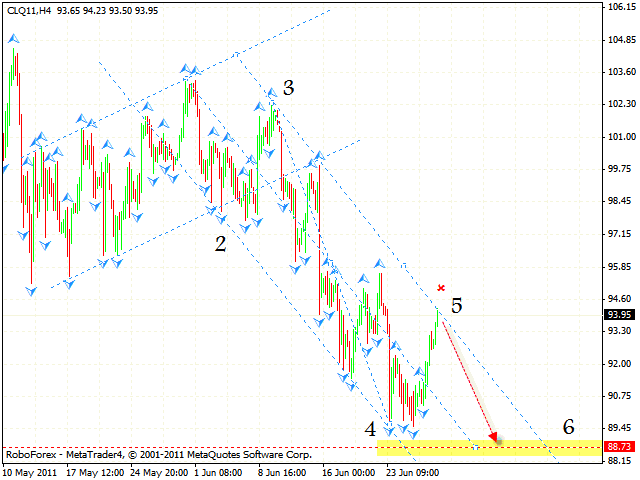
Attention!
Forecasts presented in this section only reflect the author’s private opinion and should not be considered as guidance for trading. RoboForex bears no responsibility for trading results based on trading recommendations described in these analytical reviews.