Bill Williams’ Indicators Analysis 08.05.2013 (USD/CAD, NZD/USD)
08.05.2013
Analysis for May 8th, 2013
USD/CAD
At the H4 chart of the USD/CAD currency pair, the Alligator is moving downwards. The indicators are in the red zone; the price is forming a bullish fractal; there is a Squat bar on the MFI. I’m keeping my sell order opened with the target below a bearish fractal; a protective stop is above the Alligator’s teeth.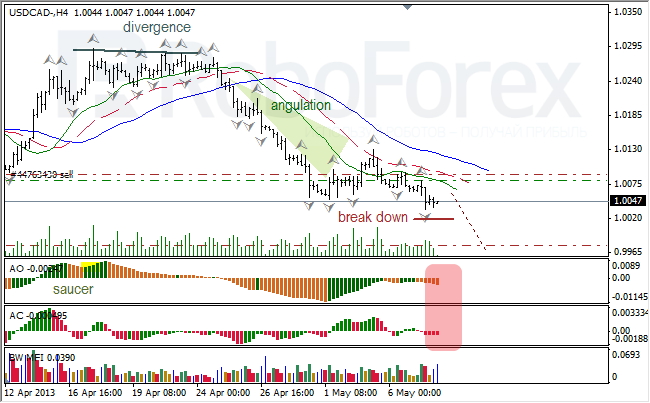
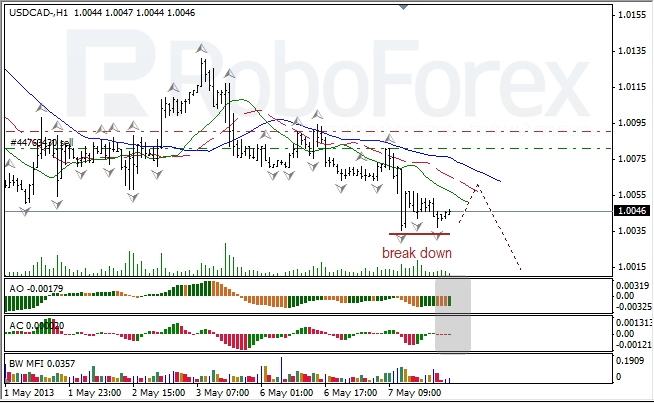
At the H1 chart of the USD/CAD currency pair, the Alligator is moving downwards. AO and AC indicators are in the grey zone; there are Squat bars on the MFI. The price is forming a bullish fractal near the Alligator’s teeth.
NZD/USD
At the H4 chart of the NZD/USD currency pair, the Alligator is opening its mouth downwards. The angle of angulation is open; the indicators are in the red zone; the price finished a bearish fractal; there might be a Squat bar on the MFI. I’m staying out of the market until the price completes a bullish fractal.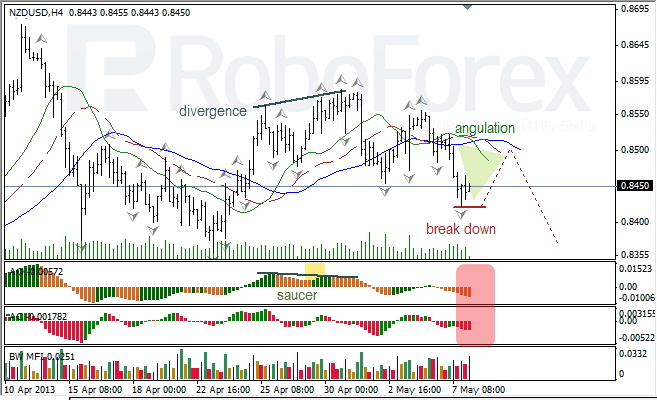
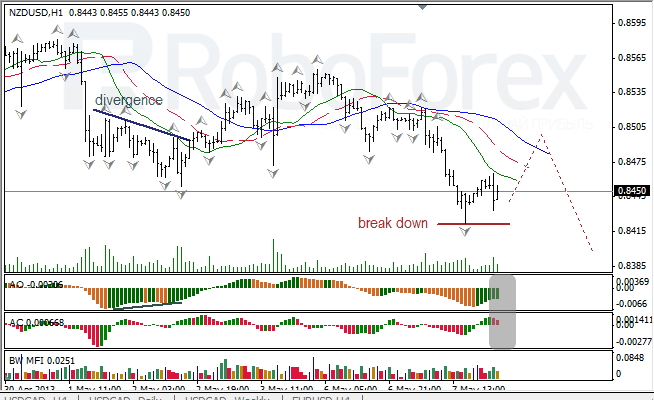
At the H1 chart of the NZD/USD currency pair, the Alligator is moving downwards. AO and AC indicators are in the grey zone; there are no Squat bars on the MFI. A bullish fractal may go through the Alligator’s mouth, but is quite unlikely to make it reverse.
RoboForex Analytical Department
Attention!
Forecasts presented in this section only reflect the author’s private opinion and should not be considered as guidance for trading. RoboForex bears no responsibility for trading results based on trading recommendations described in these analytical reviews.