Wave Analysis 20.03.2013 (DJIA Index, Crude Oil)
20.03.2013
Analysis for March 20th, 2013
DJIA Index
The main trend is still bullish. The current chart structure implies that the Index may continue growing up inside wave [5] of 5. We can’t exclude a possibility that the bulls may reach a new maximum within the next several days.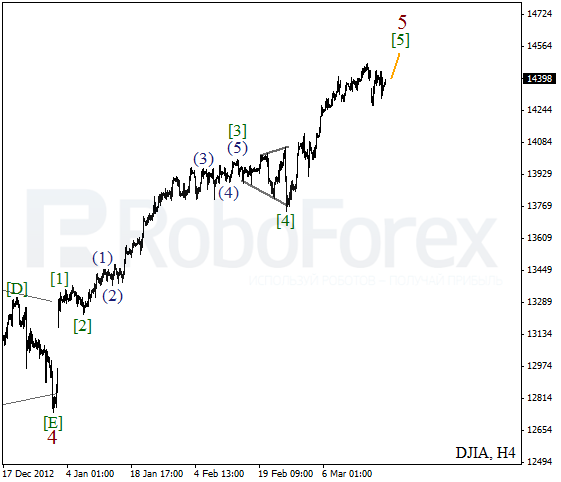
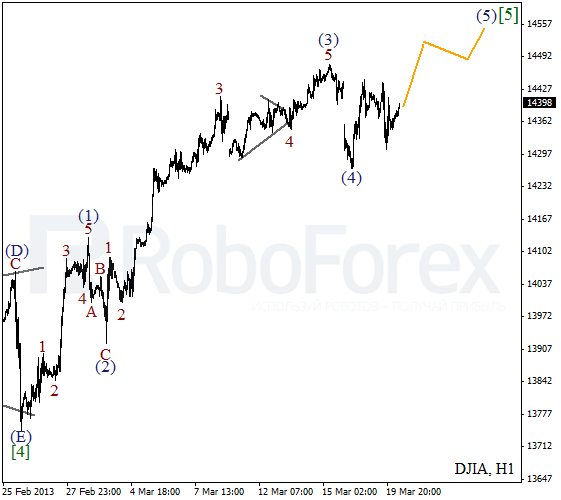
At the H1 chart we can see that the Index finished the fourth wave in the beginning of this week. Right now the bulls are trying to start a new ascending movement inside the fifth wave. The short-term target is at the level of 14550.
Crude Oil
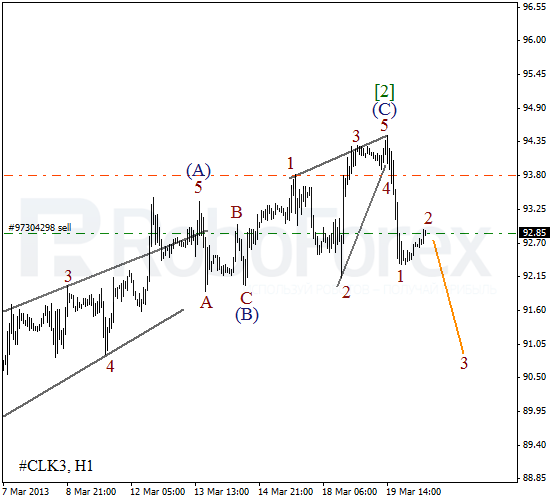
We can’t exclude a possibility that yesterday’s descending movement was the start of wave [3]. On the minor wave level the price is forming an initial impulse inside wave (1). Most likely, later the instrument will continue moving downwards.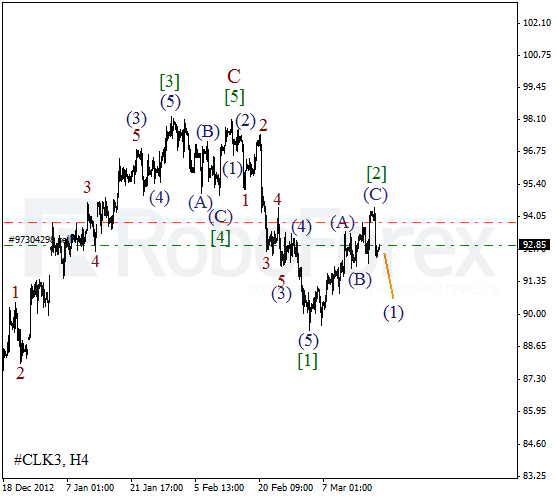
It looks like wave (C) was completed in the form of divergent diagonal triangle pattern. Earlier the instrument finished an impulse inside wave 1. After completing a local correction the price is expected to start forming the third wave.
RoboForex Analytical Department
Attention!
Forecasts presented in this section only reflect the author’s private opinion and should not be considered as guidance for trading. RoboForex bears no responsibility for trading results based on trading recommendations described in these analytical reviews.