Wave Analysis 21.03.2013 (DJIA Index, Crude Oil)
21.03.2013
Analysis for March 21st, 2013
DJIA Index
The Index is finishing the fifth wave. Earlier the price completed wave [4] in the form of divergent horizontal triangle pattern. In the near term the instrument is expected to reach a new maximum and later may start a correction.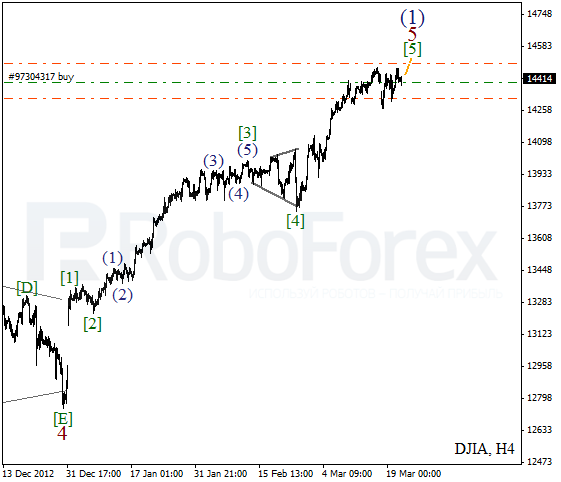
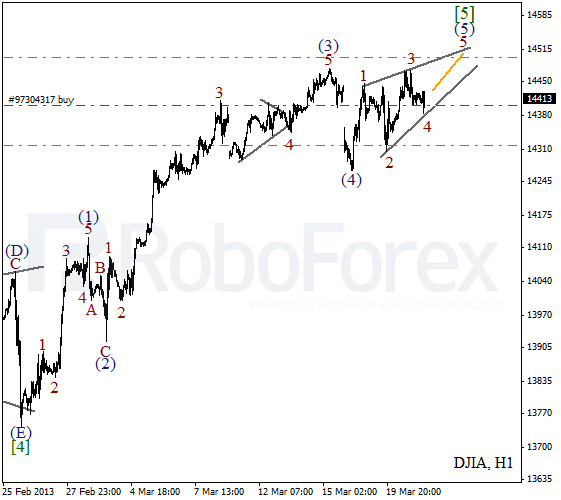
More detailed wave structure is shown on the H1 chart. The Index is forming diagonal triangle pattern inside wave (5). On the minor wave level the instrument is completing the fourth wave. During Thursday we can expect the Index to start forming wave 5 of (5).
Crude Oil
Oil completed an initial descending impulse. We may assume that wave [2] was finished in the form of zigzag pattern and right now the bears are trying to make a reverse downwards. During a local correction I opened a sell order and will move the stop into the black as soon as possible.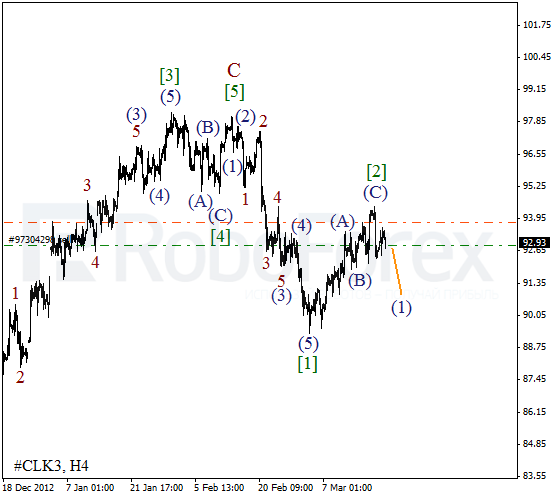
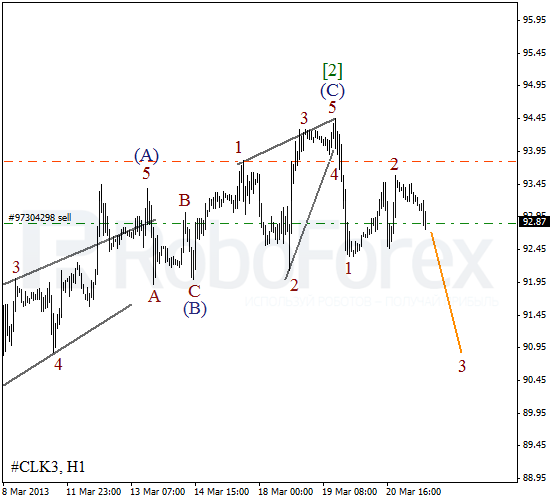
As we can see at the H1 chart, wave [2] took the form of a quite unusual zigzag pattern: wave (A) is wedge, wave (C) is diagonal triangle pattern. Most likely, in the nearest future the price will continue falling down inside the third wave.
RoboForex Analytical Department
Attention!
Forecasts presented in this section only reflect the author’s private opinion and should not be considered as guidance for trading. RoboForex bears no responsibility for trading results based on trading recommendations described in these analytical reviews.