RoboForex
Wave Analysis 08.04.2013 (DJIA Index, Crude Oil)
08.04.2013Analysis for April 8th, 2013
The Index continues forming an ascending wave 5 with the fifth wave inside it. It looks like the market is not going to stop and may reach new maximums during the next several days. I opened a buy order with the target at the level of 14670.
DJIA Index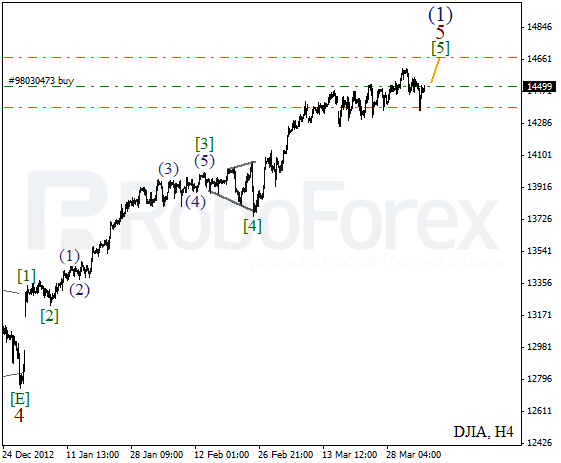
More detailed wave structure is shown on the H1 chart. It looks like the price is forming divergent diagonal triangle pattern inside wave (5). On the minor wave level, the instrument is forming the fifth wave; during the next several days, the Index is expected to continue moving upwards inside it.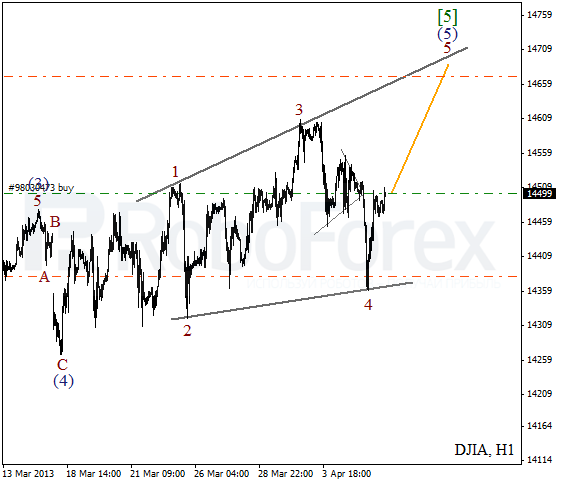
Crude Oil
The instrument is forming triangle pattern inside wave B with wave [E] inside it. After a local correction, Oil is expected to start falling down again. If the price rebounds from the pattern’s lower border, the market will start a new ascending movement.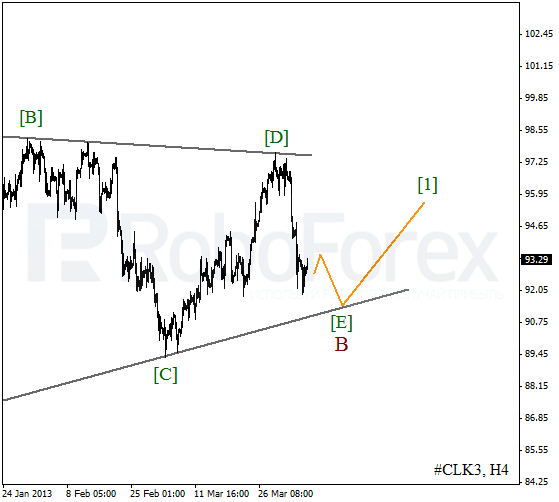
We may assume that the price completed a descending impulse inside wave (A) and then started a correction. Right now, the instrument is forming zigzag pattern inside wave (B). The correction may continue for several more days.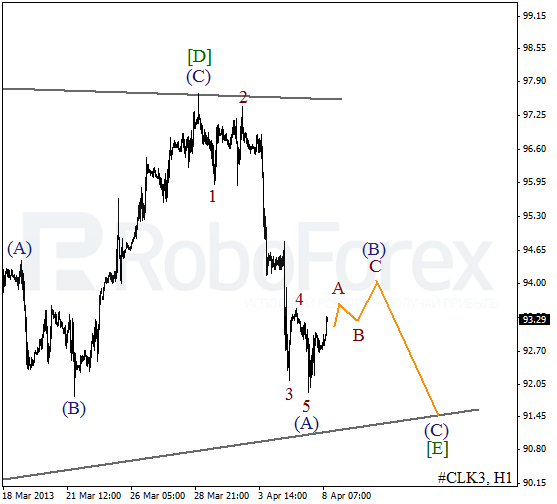
RoboForex Analytical DepartmentAttention!Forecasts presented in this section only reflect the author’s private opinion and should not be considered as guidance for trading. RoboForex bears no responsibility for trading results based on trading recommendations described in these analytical reviews.