Wave Analysis 24.04.2013 (DJIA Index, Crude Oil)
24.04.2013
Analysis for April 24th. 2013
DJIA Index
It looks like the Index is starting the fifth wave. On Tuesday, the market made a strong ascending movement, which means that it may continue growing up on Wednesday. We can’t exclude a possibility that one of these days the price may break the maximum of the third wave.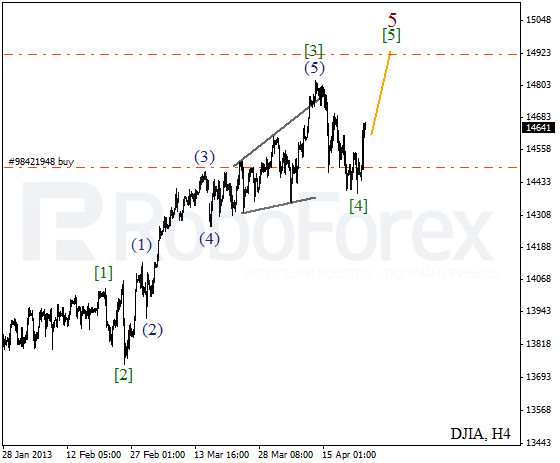
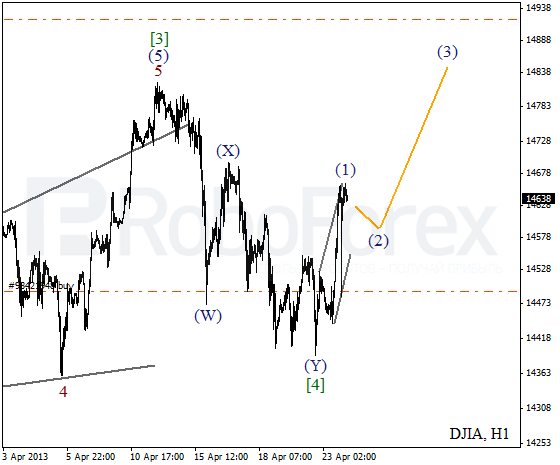
As we can see at the H1 chart, wave [4] took the form of double zigzag pattern. On the minor wave level, the market formed a bullish wedge pattern inside wave (1). After completing a local correction, the instrument may start a new ascending movement.
Crude Oil
Oil continues forming zigzag pattern inside wave E. We may assume that the price is about to finish wave [B]. Later we can expect the instrument to start a new descending movement while forming wave [C] of E.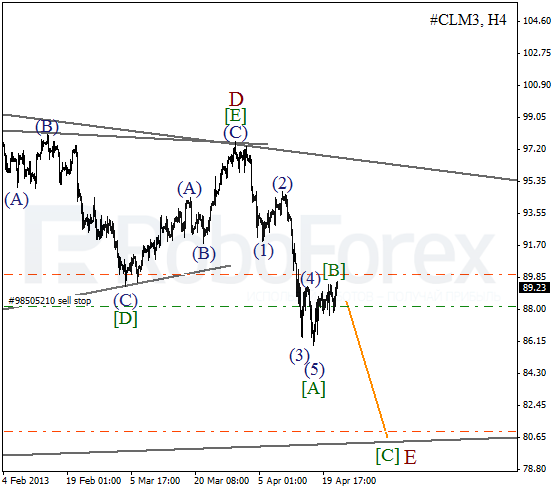
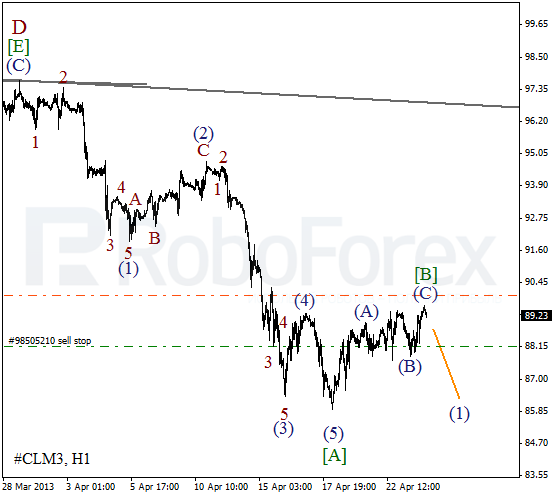
At the H1 chart, we can see that the price is completing wave [B] in the form of zigzag pattern. Most likely, in the nearest future, the price will start falling inside wave (1). In order to avoid any risks, I’m planning to open a pending order.
RoboForex Analytical Department
Attention!
Forecasts presented in this section only reflect the author’s private opinion and should not be considered as guidance for trading. RoboForex bears no responsibility for trading results based on trading recommendations described in these analytical reviews.