Wave Analysis 01.05.2013 (DJIA Index, Crude Oil)
01.05.2013
Analysis for May 1st, 2013
DJIA Index
The Index continues growing up. We may assume that after completing the fourth wave, the market is now moving inside the fifth one. The instrument may break the maximum in the nearest future. During a correction, I opened one more buy order.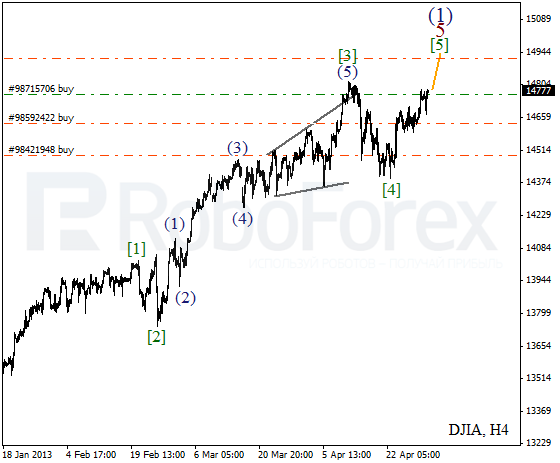
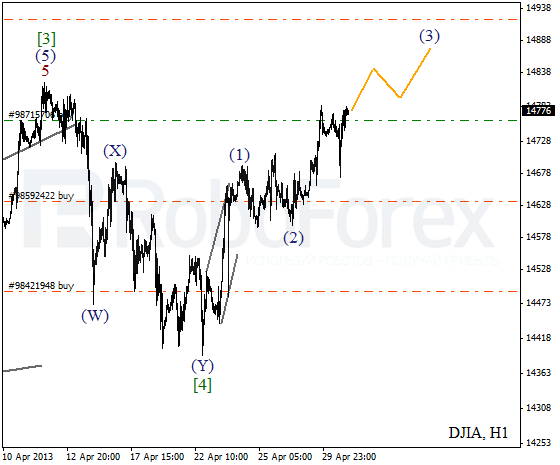
More detailed wave structure is shown on the H1 chart. Wave [4] took the form of double zigzag pattern. Currently the Index is expanding the third wave. The target is still at the level of 14950.
Crude Oil
We can’t exclude a possibility that Oil finished a correction inside wave [B]. If this assumption is correct, then right now the instrument is starting a bearish wave [C] of E. However, it’s still quite early to start selling.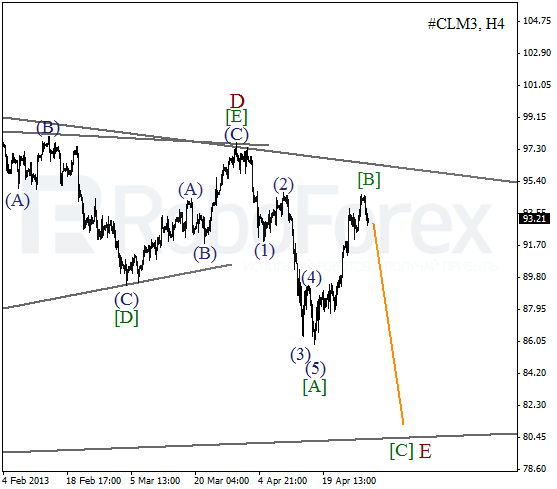
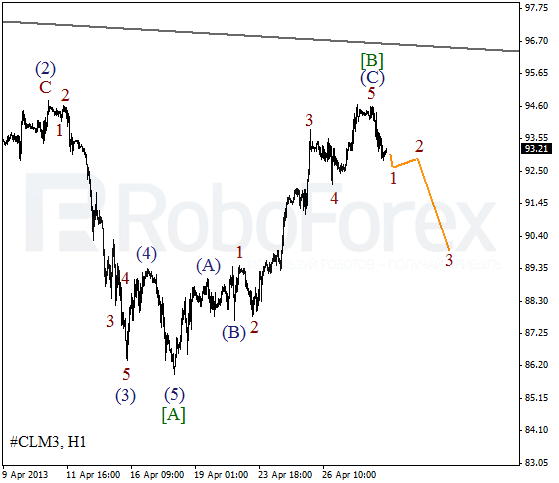
As we can see at the H1 chart, wave [B] took the form of zigzag pattern. On the minor wave level, the price is forming an initial impulse inside wave 1. The instrument is expected to continue moving downwards during the next several hours.
RoboForex Analytical Department
Attention!
Forecasts presented in this section only reflect the author’s private opinion and should not be considered as guidance for trading. RoboForex bears no responsibility for trading results based on trading recommendations described in these analytical reviews.