Wave Analysis 09.05.2014 (DJIA Index, Crude Oil)
09.05.2014
Analysis for May 9th, 2014
DJIA Index
Chart structure has been changed. Probably, after completing double three pattern inside wave [2], Index formed initial bullish impulse inside wave (1). In the near term, price may start new correction.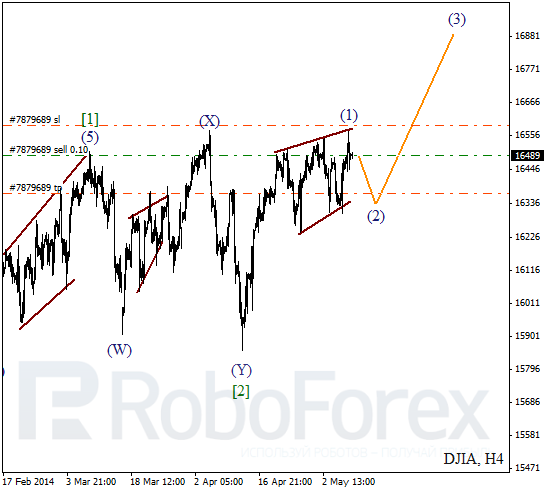
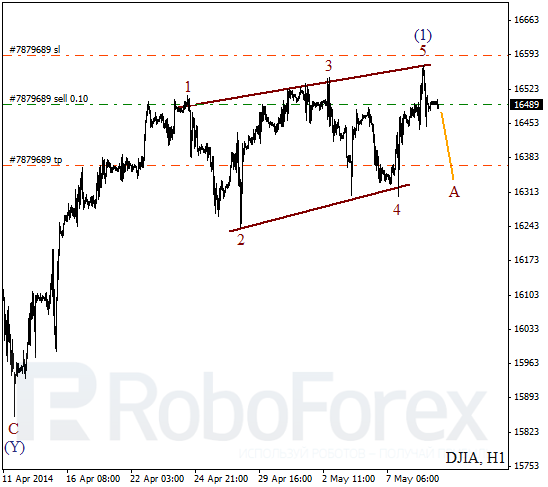
More detailed wave structure is shown on H1 chart. Probably, market started new correction, which may turn out to be quite long. I managed to open new sell order after Index rebounded from upper border of diagonal triangle pattern.
Crude Oil
Probably, Oil continues falling down inside the third wave. On minor wave level, price is finishing the second wave and about to start new descending movement inside the third one. In the future, I’m planning to open sell order right after instrument starts falling down inside wave [3].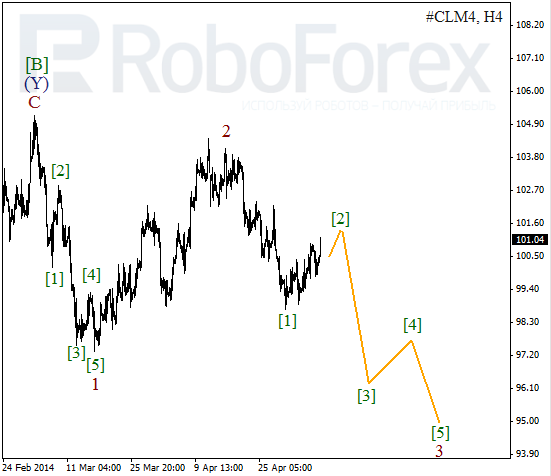
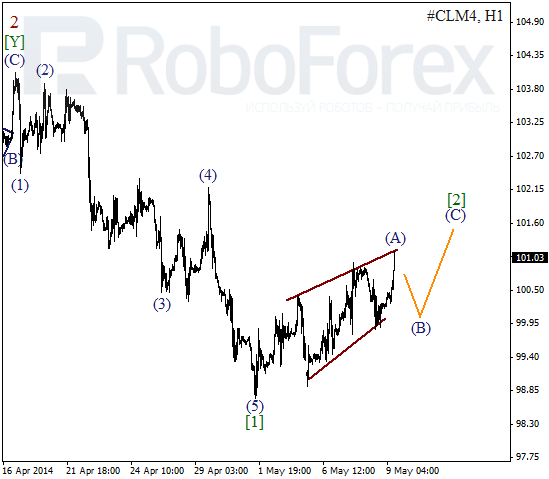
As we can see at the H1 chart, wave [2] turned out to be longer than we expected. Considering that price formed bullish wedge pattern inside wave (A), instrument is expected to start local correction. In the future, Silver may start moving upwards inside wave (C) of [2].
RoboForex Analytical Department
Attention!
Forecasts presented in this section only reflect the author’s private opinion and should not be considered as guidance for trading. RoboForex bears no responsibility for trading results based on trading recommendations described in these analytical reviews.