Wave Analysis 31.05.2013 (DJIA Index, Crude Oil)
31.05.2013
Analysis for May 31st, 2013
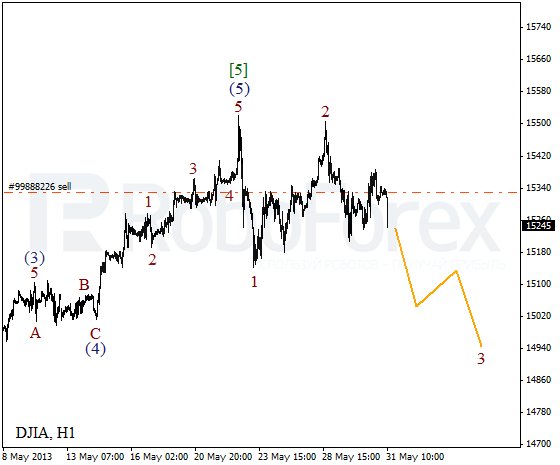
DJIA Index
We may assume that the Index is making a reverse. I’ve already moved the stop on my yesterday’s sell order into the black. Most likely, in the nearest future the price will break a local minimum while forming wave (1).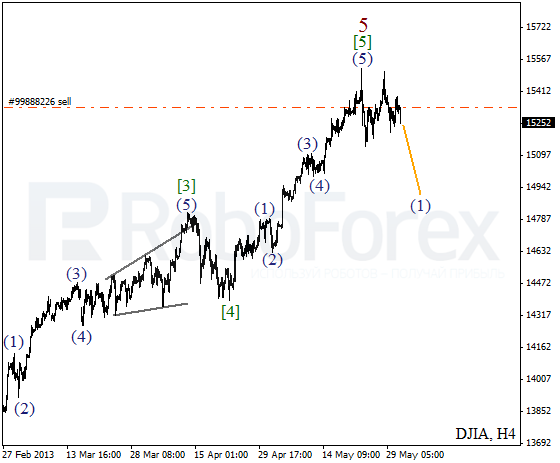
At the H1 chart, the price is starting to form an extension inside wave 3. Earlier the second wave was completed in the form of zigzag pattern near the historic maximum. The target for the third wave is the level of 14950.
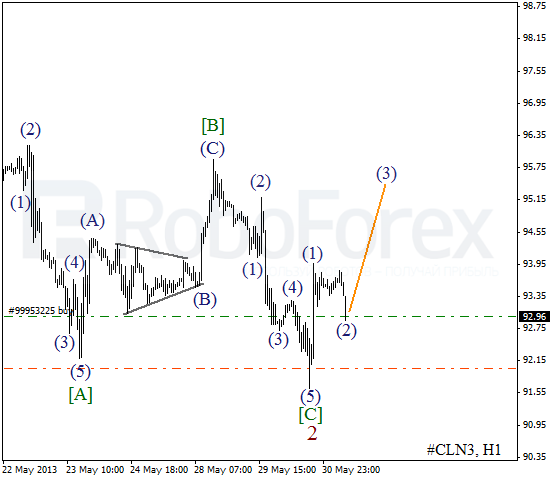
Crude Oil
We can’t exclude a possibility that Oil completed wave 2; this correction took the form of zigzag pattern. On the minor wave level, the price formed an initial ascending impulse. Later the instrument is expected to continue moving upwards inside wave [1].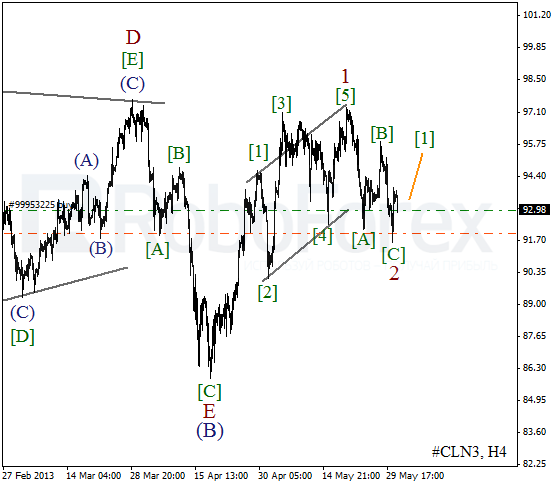
At the H1 chart, the price completed an impulse inside wave [C] of 2 and then started moving upwards quite fast inside wave (1). During a local correction, I opened a buy order and plan to move the stop into the black as soon as the instrument breaks a local maximum.
RoboForex Analytical Department
Attention!
Forecasts presented in this section only reflect the author’s private opinion and should not be considered as guidance for trading. RoboForex bears no responsibility for trading results based on trading recommendations described in these analytical reviews.