Wave Analysis 20.06.2013 (DJIA Index, Crude Oil)
20.06.2013
Analysis for June 20th, 2013
DJIA Index
We may assume that the Index is forming horizontal triangle pattern inside the fourth wave. On the minor wave level, the price is completing wave (E). If the market rebounds from the pattern’s lower border, the instrument may start a new initial ascending impulse.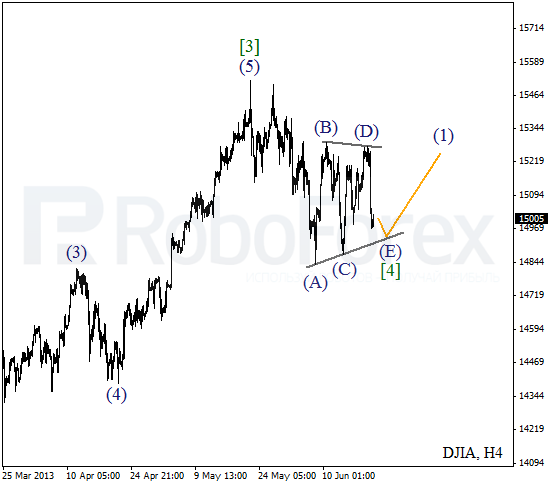
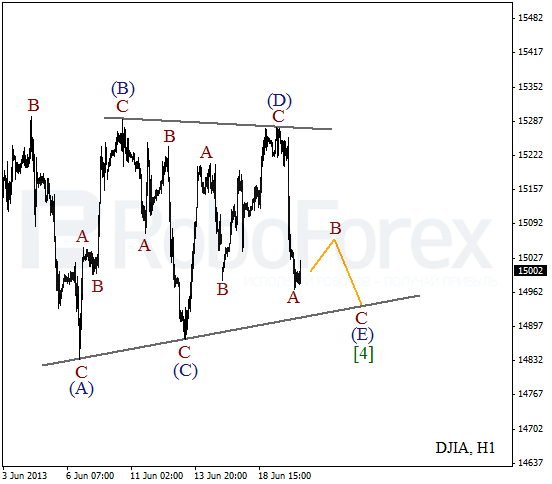
More detailed wave structure is shown on the H1 chart. The Index is forming zigzag pattern inside wave (E). The instrument may be corrected for a while during the day, but later it is expected to continue moving downwards inside wave C of (E).
Crude Oil
The main scenario remains the same: Oil continues forming the third wave. On the minor wave level, the price is forming wave [4]. It looks like the current correction reached its minimum and later the instrument may start forming flat pattern. Yesterday my Take Profits worked and right now I’m staying out of the market.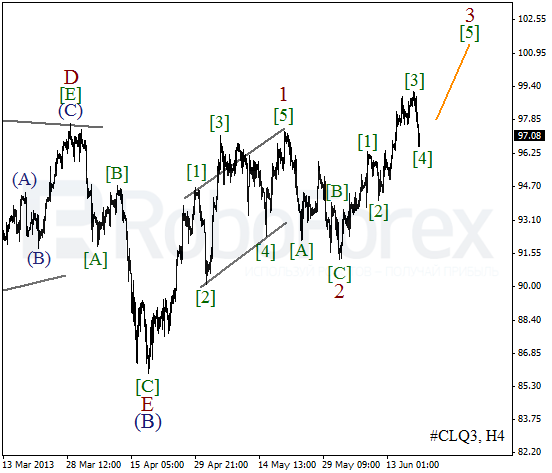
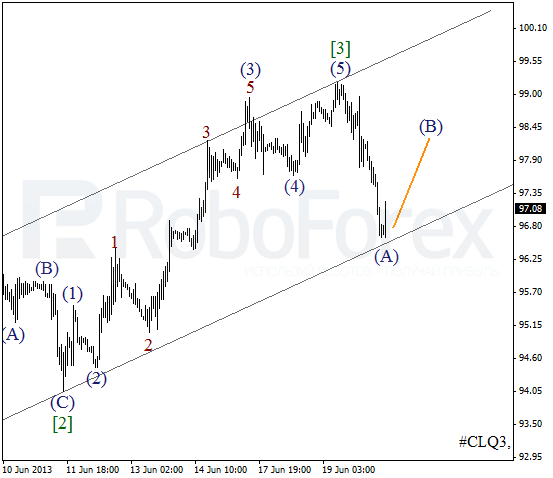
At the H1 chart we can see, that the instrument reached the channel’s lower border. If the price rebounds from it, the bulls will return to the market. And we should note that wave [4] may take the form of both, horizontal triangle or double three patterns.
RoboForex Analytical Department
Attention!
Forecasts presented in this section only reflect the author’s private opinion and should not be considered as guidance for trading. RoboForex bears no responsibility for trading results based on trading recommendations described in these analytical reviews.