Wave Analysis 26.06.2013 (DJIA Index, Crude Oil)
26.06.2013
Analysis for June 26th, 2013
DJIA Index
We can’t exclude a possibility that that the fourth wave is completed; it looks like the correction took the form of zigzag pattern. On the minor wave level, the price is forming an initial ascending impulse. I’m planning to move the stop into the black right after the price breaks a local maximum.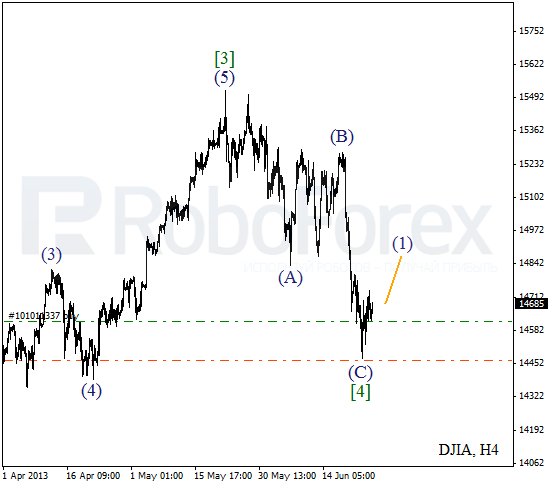
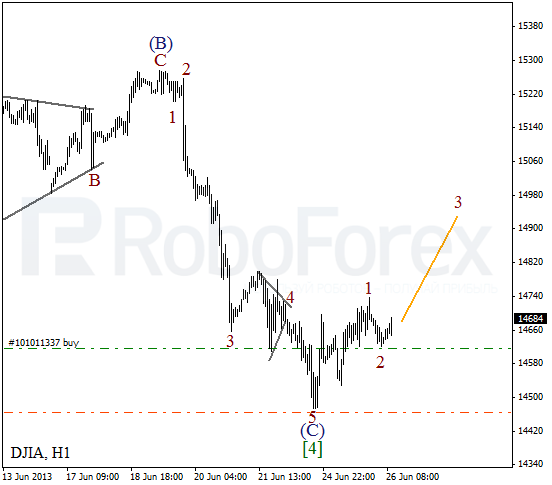
More detailed wave structure is shown on the H1 chart. We may assume that after completing an impulse inside wave (C), the Index formed a bullish impulse inside wave 1. The instrument may start forming the third wave during the day.
Crude Oil
After completing triangle pattern inside wave D, Oil formed a bearish impulse inside wave [A]. Right now, the instrument is being corrected. Most likely, the price will grow up a little bit inside wave [B].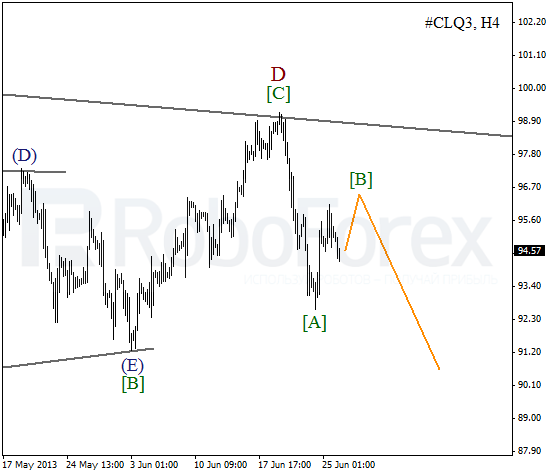
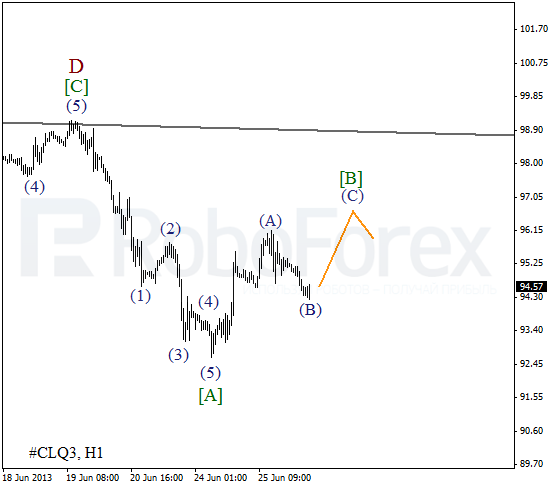
After completing an impulse inside wave [A], the market started a correction. It looks like wave [B] is taking the form of zigzag pattern. In the near term, the price may move upwards a little bit inside wave (C) of [B].
RoboForex Analytical Department
Attention!
Forecasts presented in this section only reflect the author’s private opinion and should not be considered as guidance for trading. RoboForex bears no responsibility for trading results based on trading recommendations described in these analytical reviews.