Wave Analysis 12.07.2011 (USD/CHF, EUR/USD)
12.07.2011
Analysis for July 12th, 2011
USD/CHF
The market was only able to break the triangle’s lower border, and then the correction started. Most likely it won’t be long, and the descending movement, which is forming wave [5] of 3, will resume.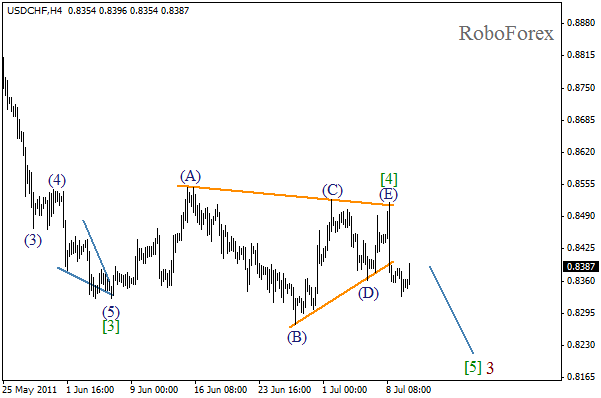
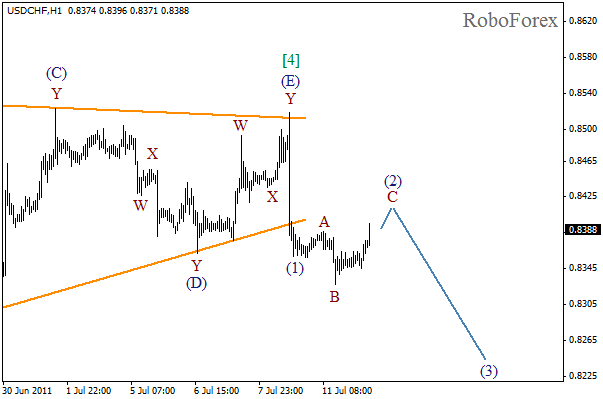
Quick impulse in wave (1) was replaced by a slow correction in wave (2) in the form of flat pattern. On the minor wave level we can see the formation of wave C. The forecast is still bearish.
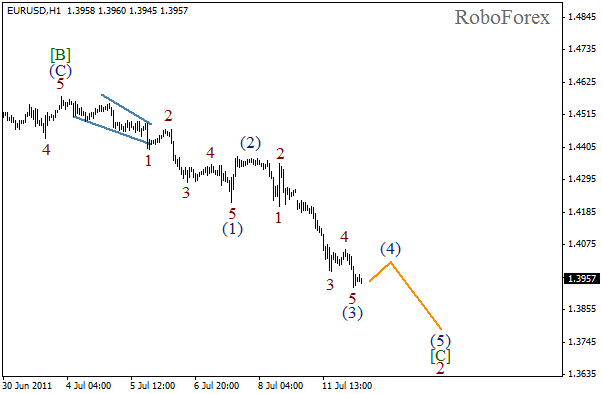
EUR/USD
Yesterday the price broke the minimum, which makes us to take a closer look to wave markings. It looks like wave 2 is being formed in the form of zigzag pattern. The most difficult part of this wave is wave [B]. Currently we can see the formation of wave [C], but I don’t think that its range will be more than the one of wave [A]. During the next several days we should expect the end of the correction and the continuation of bullish trend.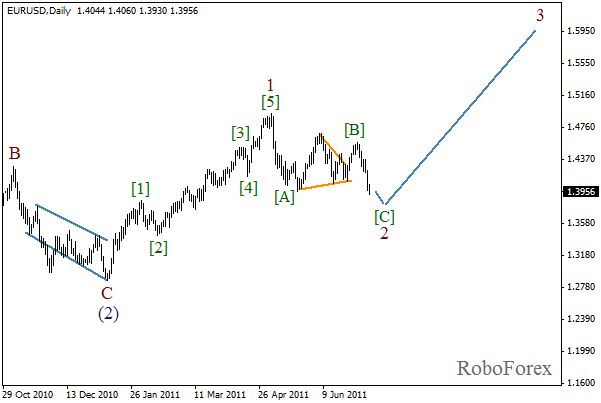
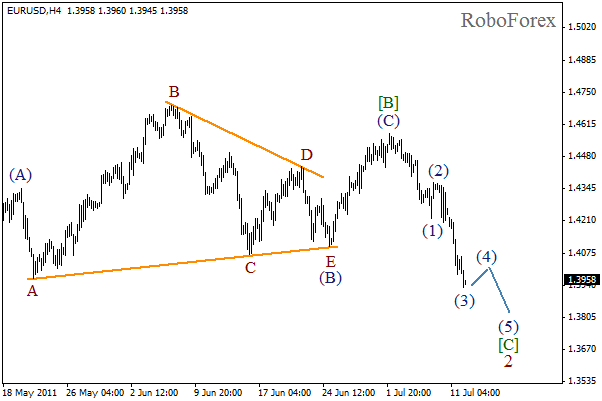
At the H4 chart we can see that wave [B] includes a horizontal triangle inside wave (B). We also can see the formation of wave [C] with the third wave inside it. Local correction may take place, and after it is finished, we should expect the start of wave (5).
More detailed marking is shown on the H1 chart. Internal structure of wave (3) let us suppose that this wave may be finished. The forecast of price movement is shown on the chart. The formation of wave [C] may continue during the day, but soon it will be finished.
Attention!
Forecasts presented in this section only reflect the author’s private opinion and should not be considered as guidance for trading. RoboForex bears no responsibility for trading results based on trading recommendations described in these analytical reviews.