Wave Analysis 17.07.2013 (DJIA Index, Crude Oil)
17.07.2013
Analysis for July 17th, 2013
DJIA Index
The Index is being corrected, making a small pause before breaking the historic maximum. Most likely, in the nearest future the price will start moving upwards inside the third wave. The target for the bulls is still at the level of 15600.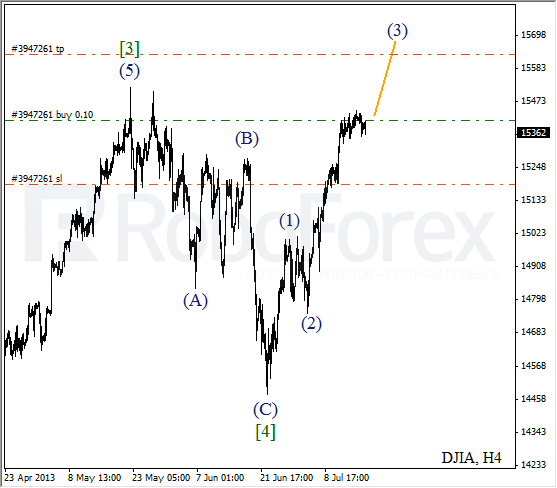
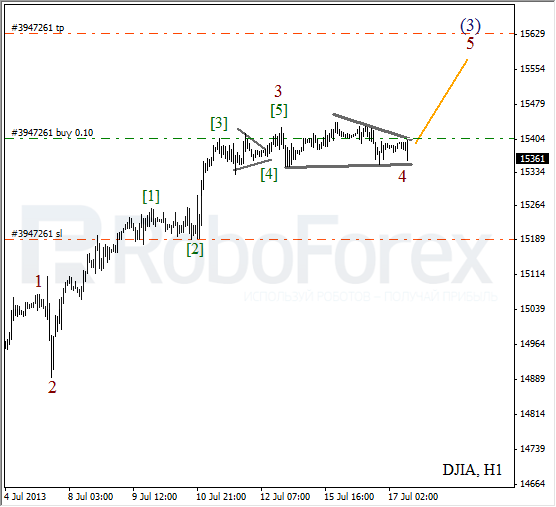
More detailed wave structure is shown on the H1 chart. It looks like the market is forming horizontal triangle pattern inside wave 4. As soon as the price completes an initial impulse inside the fifth wave, I’m planning to open one more buy order.
Crude Oil
Oil is being corrected inside the fourth wave. The stop on my yesterday’s sell order is already in the black. There is a possibility that the price may break a local minimum until the end of this week.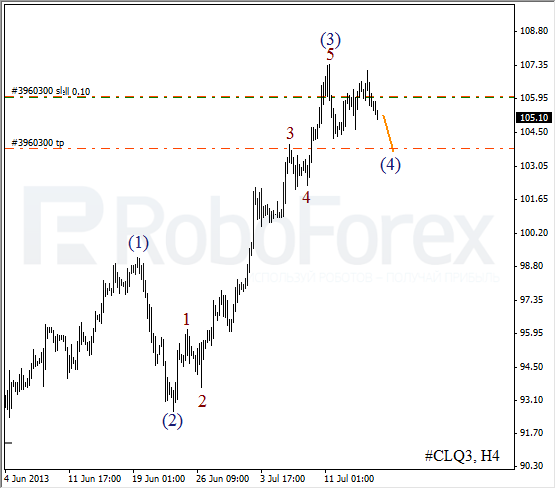
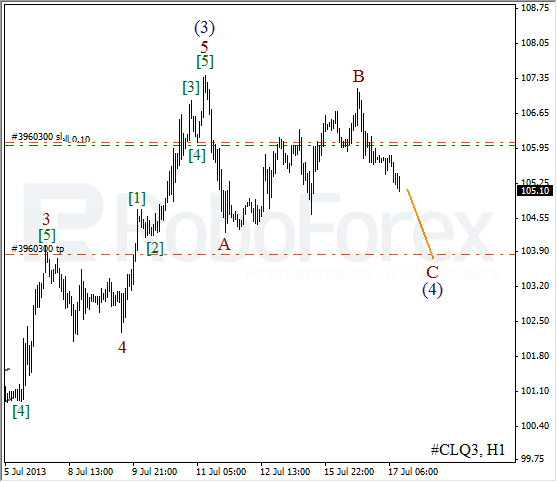
As we can see at the H1 chart, wave (4) is taking the form of zigzag pattern. Yesterday the price completed wave B. In the nearest future, the instrument is expected to start a new descending movement inside wave C of (4).
RoboForex Analytical Department
Attention!
Forecasts presented in this section only reflect the author’s private opinion and should not be considered as guidance for trading. RoboForex bears no responsibility for trading results based on trading recommendations described in these analytical reviews.