Wave Analysis 08.08.2013 (DJIA Index, Crude Oil)
08.08.2013
Analysis for August 8th, 2013
DJIA Index
We may assume that the Index made a reverse; earlier the price completed an ascending impulse inside wave [5]. Most likely, after completing a local correction, the instrument will continue moving downwards.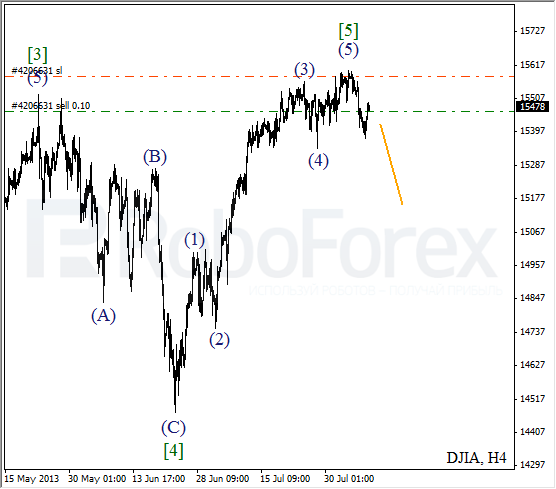
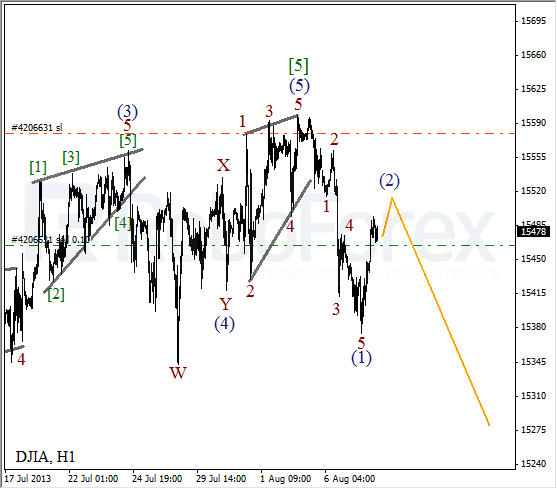
As we can see at the H1 chart, the price formed diagonal triangle pattern inside wave (5). After that, the Index finished a descending impulse and then started forming the second wave. The instrument may start the third wave during the day.
Crude Oil
Oil is still being corrected. The mains scenario is still the same (the price may continue moving upwards inside wave (5)), but the deeper the instrument moves, the less plausible this scenario may seem. However, it will remain in effect until the price breaks a local minimum.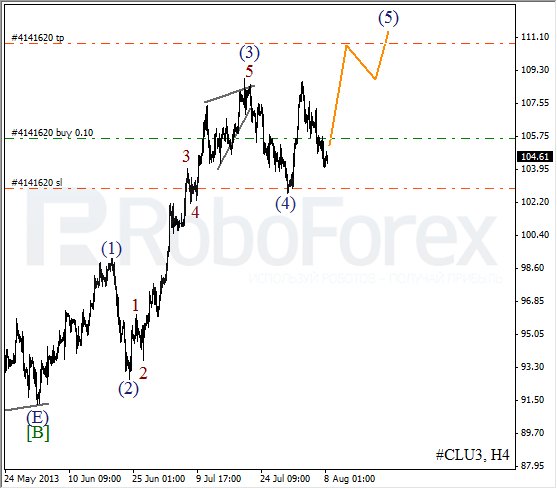
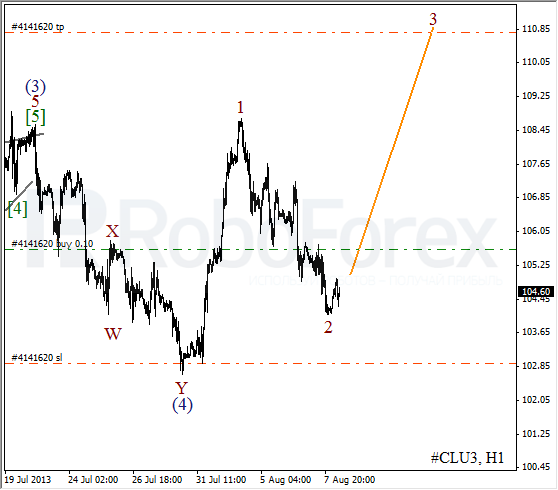
More detailed wave structure is shown on the H1 chart. Wave (4) took the form of doublezigzag pattern. On the minor wave level, the price is completing wave 2 and may start forming the third one in the nearest future.
RoboForex Analytical Department
Attention!
Forecasts presented in this section only reflect the author’s private opinion and should not be considered as guidance for trading. RoboForex bears no responsibility for trading results based on trading recommendations described in these analytical reviews.