Wave Analysis 27.09.2012 (DJIA Index, Crude Oil)
27.09.2012
Analysis for September 27th, 2012
DJIA Index
It looks like wave (5) of [1] is taking the form of diagonal triangle pattern. In the near term, the Index may start moving upwards again. The target for the bulls for the next several days is at the level of 13700.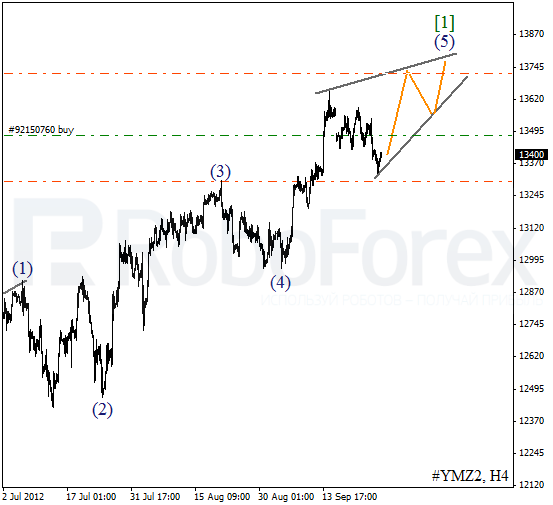
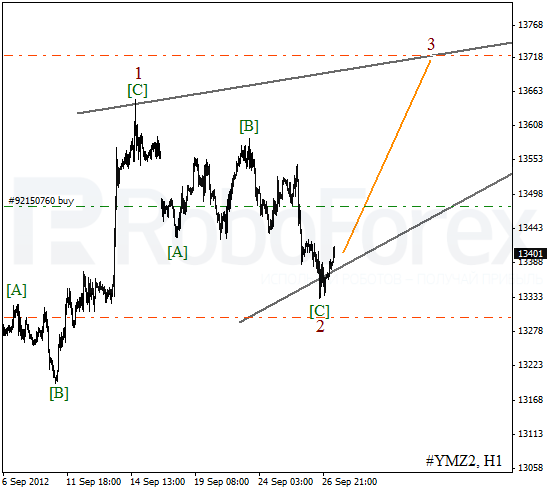
As we can see at the H1 chart, wave 2 has been completed in the form of zigzag pattern. It looks like the price is starting to form the third wave. The Index may reach a new local minimum within the next several days.
Crude Oil
Oil continues forming wave 2. We may assume that a correction is taking the form of zigzag pattern with wave [C] inside it. In the near term, we can expect the price to continue falling down. The target is at the level of $87 per barrel of Light Sweet.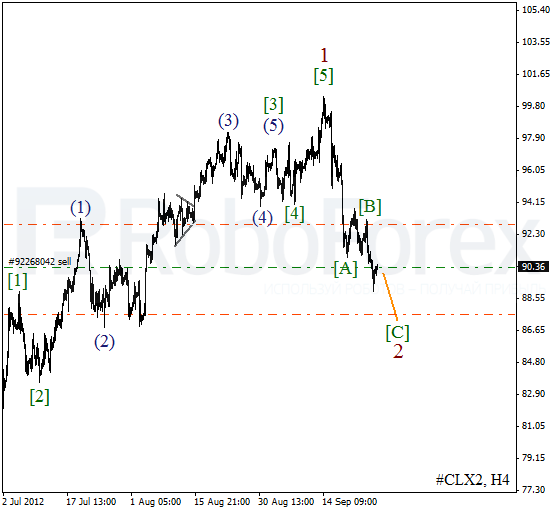
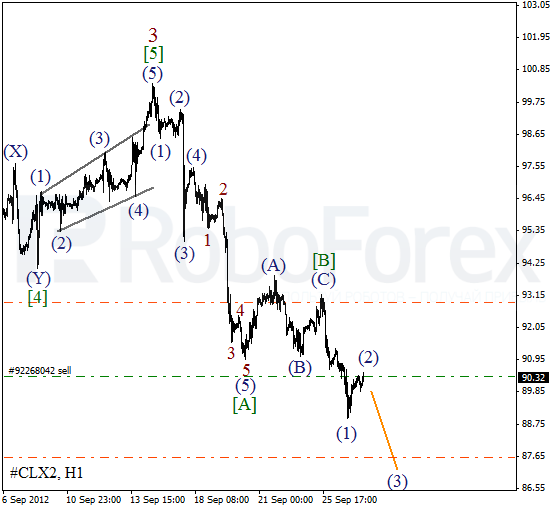
More detailed wave structure is shown on the H1 chart. Yesterday the price formed an initial descending impulse inside wave (1). After the instrument finishes a corrective movement, Oil will most probably start growing up inside wave (3) of [C].
Attention!
Forecasts presented in this section only reflect the author’s private opinion and should not be considered as guidance for trading. RoboForex bears no responsibility for trading results based on trading recommendations described in these analytical reviews.