Wave Analysis 01.10.2012 (DJIA Index, Crude Oil)
01.10.2012
Analysis for October 1st, 2012
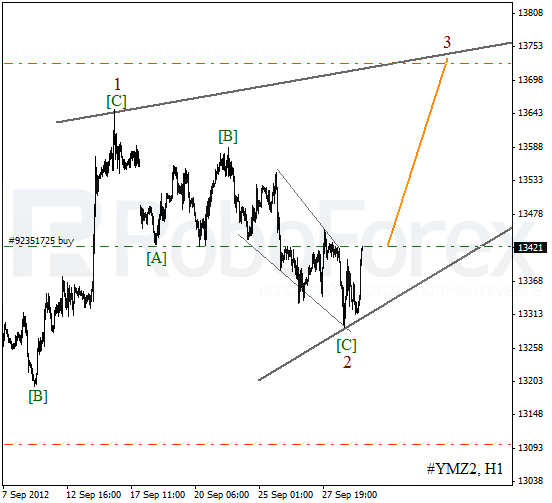
DJIA Index
The chart hasn’t changed much. It looks like the price continues forming diagonal triangle pattern inside wave (5) of [1]. Most likely, in the nearest future the Index will start moving upwards again.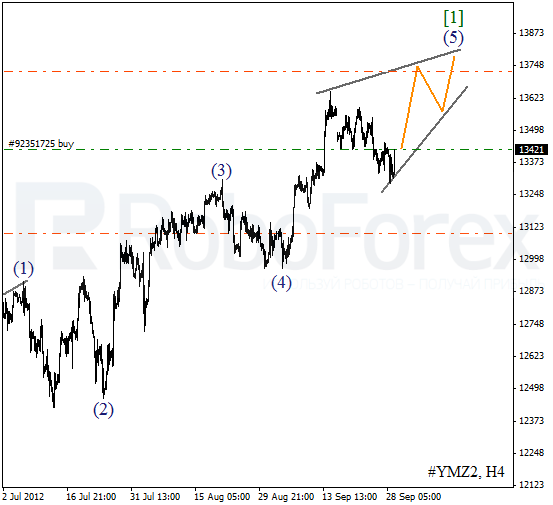
As we can see at the H1 chart, wave [C] of 2 has been completed in the form of diagonal triangle pattern. The bulls are trying to start moving the price upwards and form wave 3. We can’t exclude a possibility that the instrument may break a local maximum and reach the level of 13700 within the next several days.
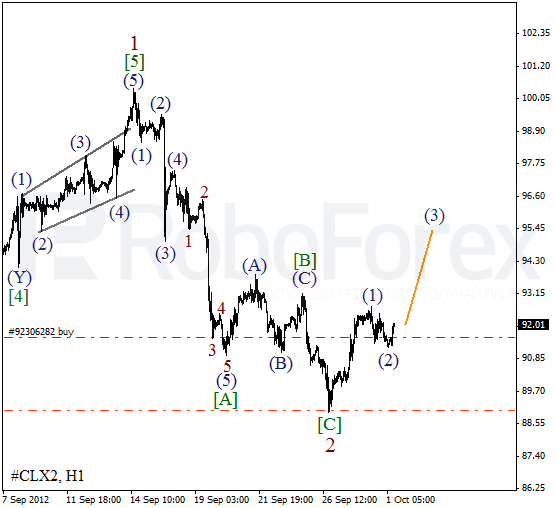
Crude Oil
We may assume that wave 2 has been finished in the form of zigzag pattern. On the minor wave level Oil is forming an initial wave [1]. In the near term, we can expect the price to continue growing up.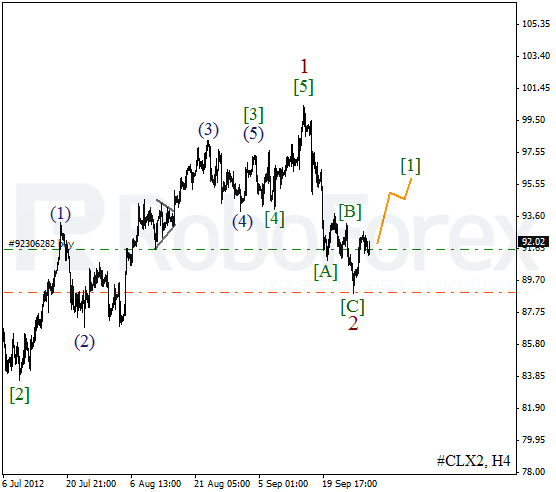
As we can see at the H1 chart, Oil has completed an initial impulse inside wave (1) and finished a corrective movement as well. During Monday the price is expected to move upwards and form wave (3) of [1].
Attention!
Forecasts presented in this section only reflect the author’s private opinion and should not be considered as guidance for trading. RoboForex bears no responsibility for trading results based on trading recommendations described in these analytical reviews.