Wave Analysis 03.10.2013 (DJIA Index, Crude Oil)
03.10.2013
Analysis for October 3rd, 2013
DJIA Index
The Index continues forming diagonal triangle pattern inside wave [5]. On the minor wave level, the market is completing the fourth wave. If the price rebounds from the pattern’s lower border, the instrument may start a new ascending movement.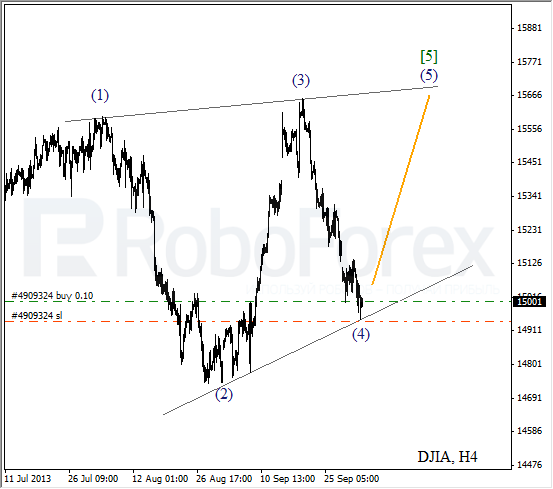
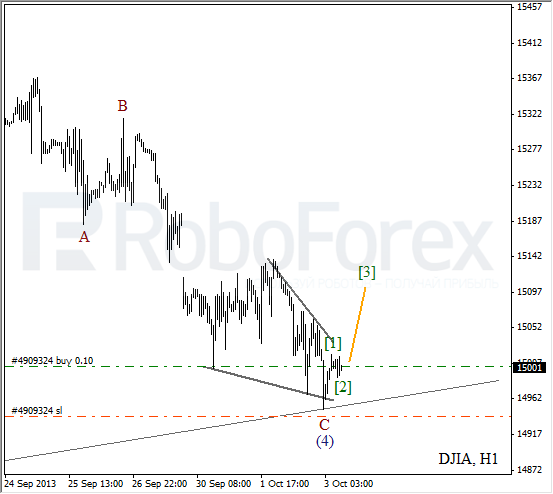
More detailed wave structure is shown on the H1 chart. The price formed diagonal triangle pattern inside wave C, thus completing the current correction. Later, the market finished an initial impulse inside wave (1), Right now, the Index is forming a local correction after which the market may start moving upwards inside the third wave.
Crude Oil
We may assume that Oil finished double three pattern inside wave (4). The bulls are trying to form an initial impulse inside wave 1. If they succeed, then after completing the second wave the price may start a fast ascending movement inside the third one.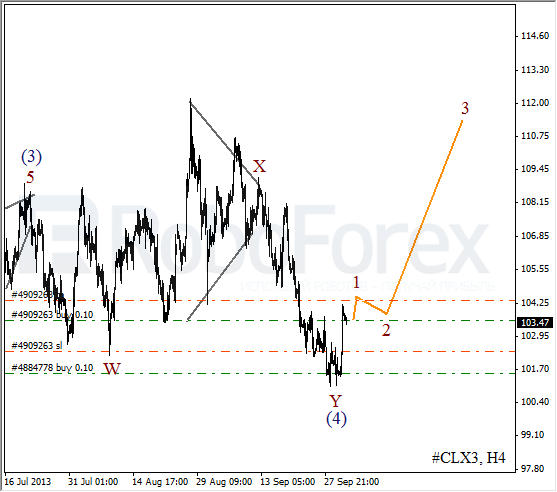
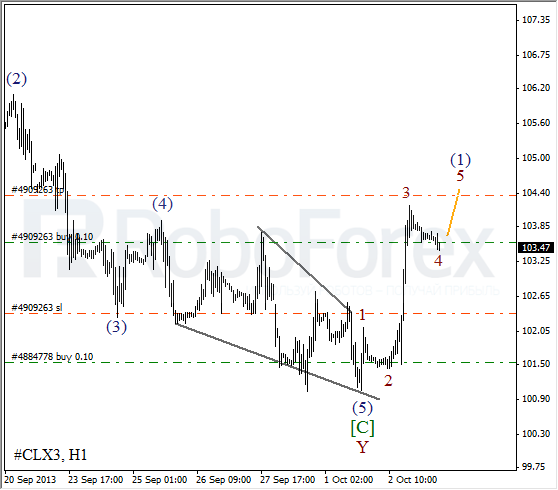
As we can see at the H1 chart, wave (5) of [C] took the form of ending diagonal triangle. Right now, the market is forming a bullish impulse with the fourth wave inside it. We can’t exclude a possibility that the instrument may break the maximum while forming wave 5 of (1) during the day.
RoboForex Analytical Department
Attention!
Forecasts presented in this section only reflect the author’s private opinion and should not be considered as guidance for trading. RoboForex bears no responsibility for trading results based on trading recommendations described in these analytical reviews.