Wave Analysis 12.10.2012 (DJIA Index, Crude Oil)
12.10.2012
Analysis for October 12th, 2012
DJIA Index
It looks like the Index continues forming zigzag pattern inside wave [2]. In the near term, the instrument may continue falling down for a while, however later it is expected to start moving upwards inside the third wave.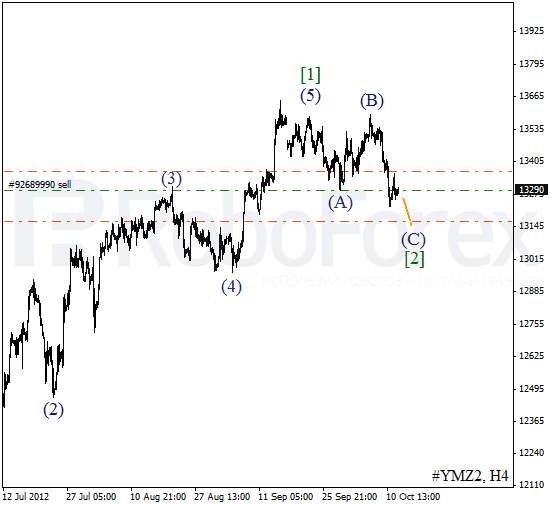
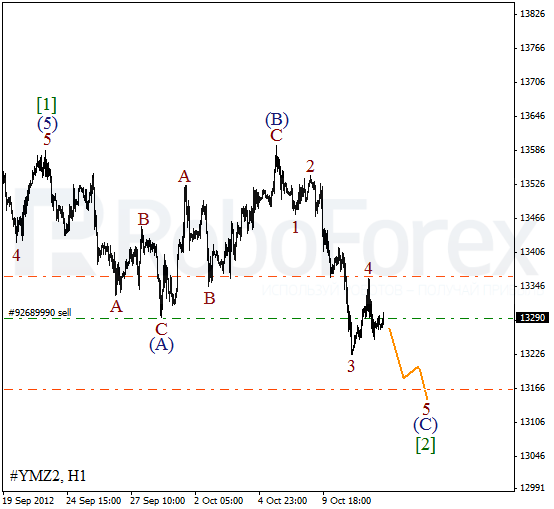
More detailed wave structure is shown on the H1 chart. We may assume that yesterday the price formed wave 4. Most likely, during Friday the instrument will start moving downwards and form a bearish wave 5 of (C).
Crude Oil
We may assume that Oil is forming an initial wave [1]. Earlier the price finished zigzag pattern inside wave 2. If the bulls are able to complete an initial impulse, I’ll try to enter the longs during a correction.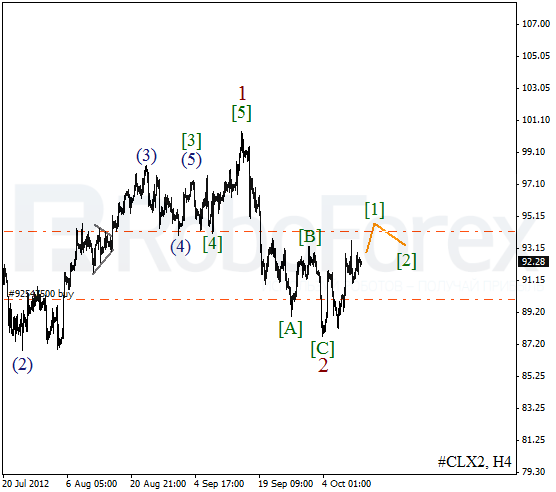
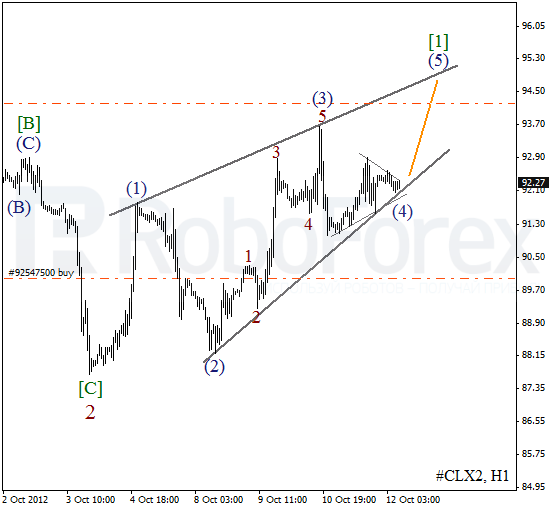
As we can see at the H1 chart, Oil is forming an ascending wedge pattern. On the minor wave level the price is finishing horizontal triangle pattern inside wave (4). In the near term, we can expect Oil to start moving upwards and form wave (5) of [1].
RoboForex Analytical Department
Attention!
Forecasts presented in this section only reflect the author’s private opinion and should not be considered as guidance for trading. RoboForex bears no responsibility for trading results based on trading recommendations described in these analytical reviews.