Wave Analysis 23.10.2012 (DJIA Index, Crude Oil)
23.10.2012
Analysis for October 23rd, 2012
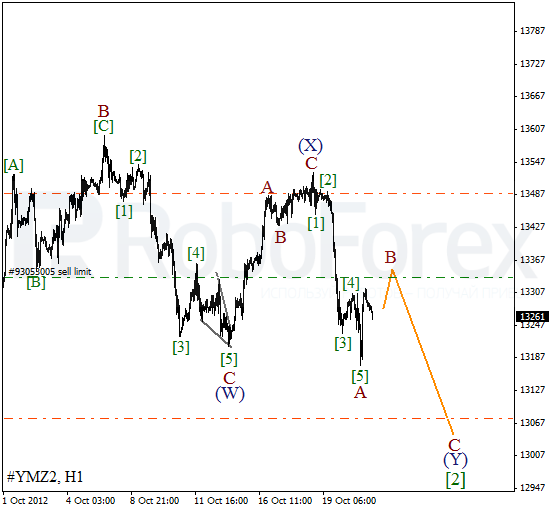
DJIA Index
The bears were able to break a critical level on Monday and we had to reconsider the chart structure. It looks like the Index is forming double zigzag pattern inside wave [2]. The instrument may continue moving downwards inside wave (Y) during the next several days.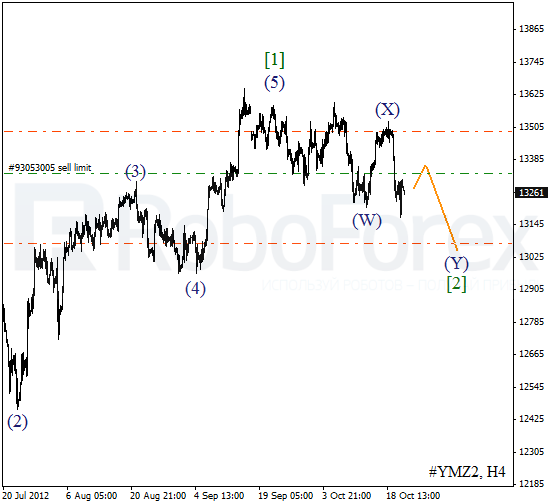
As we can see at the H1 chart, yesterday the price formed an impulse inside wave A. Currently a local correction is taking place. We can’t exclude a possibility that the Index may start falling down and form wave C of (Y) during the day.
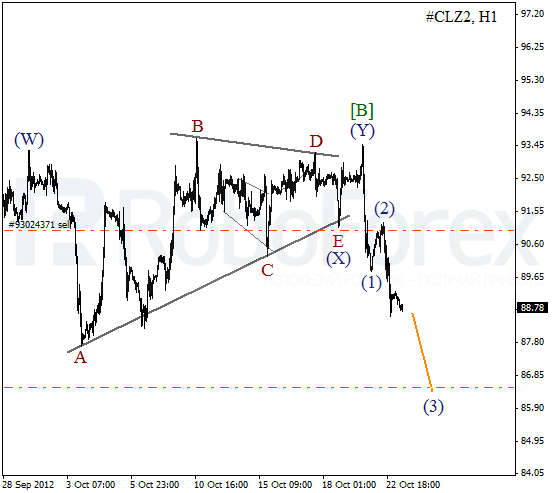
Crude Oil
Yesterday Oil continued forming wave [C] of 2. There is a possibility that the price may break a local minimum within the next several hours. The target for the bears is still at the level of $86.50 per barrel of Light Sweet.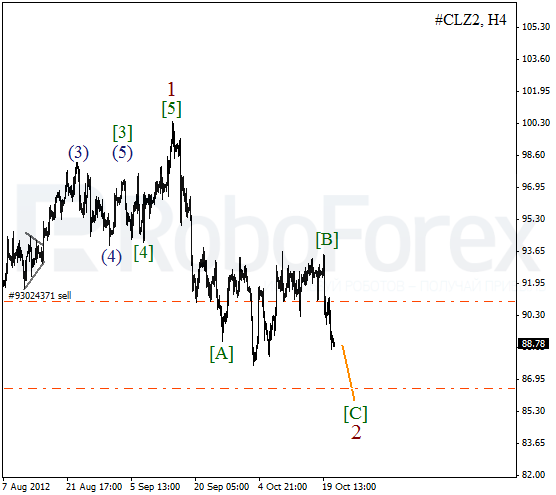
More detailed wave structure is shown on the H1 chart. Wave [B] took the form of double three pattern. On the minor wave level the price is forming the third wave. Most likely, Oil will continue moving downwards in the nearest future.
RoboForex Analytical Department
Attention!
Forecasts presented in this section only reflect the author’s private opinion and should not be considered as guidance for trading. RoboForex bears no responsibility for trading results based on trading recommendations described in these analytical reviews.