Wave Analysis 01.11.2012 (DJIA Index, Crude Oil)
01.11.2012
Analysis for November 1st, 2012
DJIA Index
The Index continues a corrective movement. It looks like wave [2] is taking the form of double zigzag pattern. On the minor wave level the instrument is forming zigzag pattern inside wave (Y). We can’t exclude a possibility that the price may reach a new local minimum in the nearest future.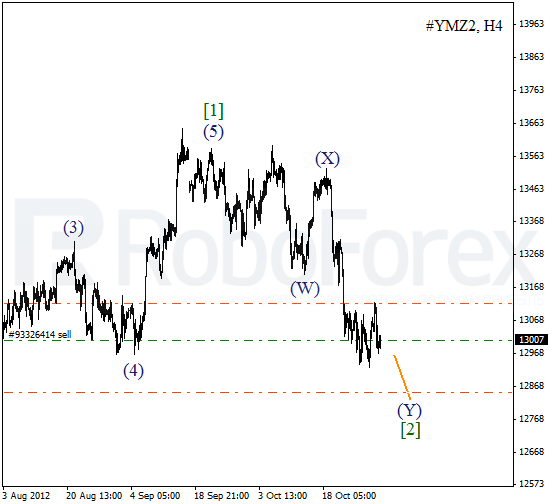
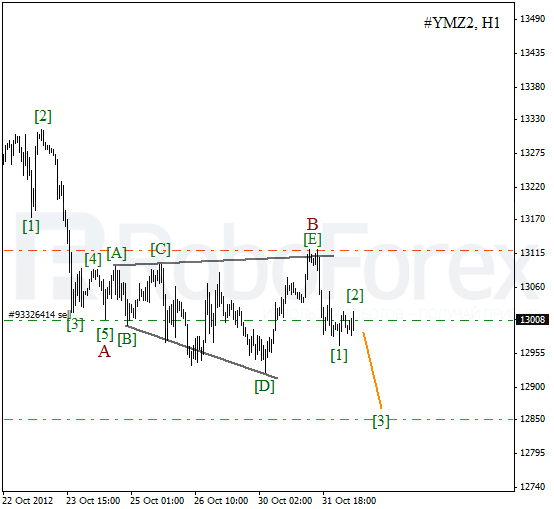
As we can see at the H1 chart, wave B took the form of quite a rare wave pattern, divergent horizontal triangle. On the minor wave level the Index formed a descending impulse inside wave [A]. Later we can expect the price to start growing up and form wave [3] of C.
Crude Oil
It looks like Oil finished zigzag pattern inside wave 2. On the minor wave level the price is starting to form an ascending impulse inside wave [1]. Most likely, in the nearest future the instrument will continue moving upwards.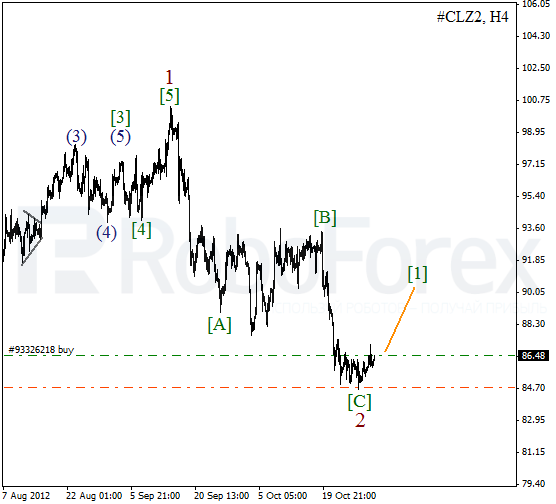
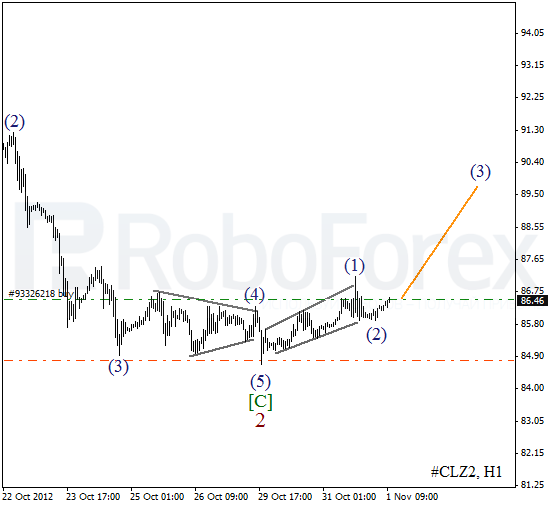
More detailed wave structure is shown on the H1 chart. We may assume that the price formed wedge pattern inside wave (1). A local correction was completed, so we can expect the price to start growing up inside the third wave during the day.
RoboForex Analytical Department
Attention!
Forecasts presented in this section only reflect the author’s private opinion and should not be considered as guidance for trading. RoboForex bears no responsibility for trading results based on trading recommendations described in these analytical reviews.