Wave Analysis 15.11.2011 (USD/CHF, EUR/USD)
15.11.2011
Analysis for November 15th, 2011
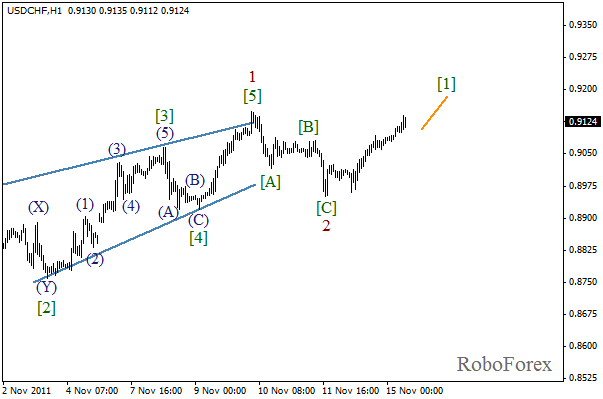
USD/CHF
After completing wave (B) in the form of zigzag pattern, the price formed a rising wedge pattern in wave 1. We may assume that the second wave has also been completed, and at the moment the market is growing in the third one. The price got very close to the local maximum, and may break it in the nearest future.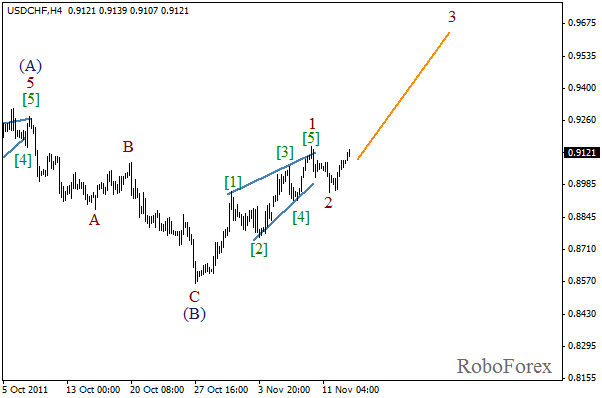
More detailed wave markings are shown on the H1 chart. It looks like the price, after completing zigzag pattern in wave 2, started the formation of an initial rising impulse inside the third one. During the day the market may continue growing while forming wave [1].
EUR/USD
The EUR/USD currency pair keeps being very unstable, and just can’t “decide” which direction to move. It looks like the price is forming horizontal triangle pattern in wave [B]. If this assumption is correct, the market may start the formation of wave (E) inside this pattern. In the future, after the pair rebounds from the triangle’s upper border, the price will start falling down in wave [C].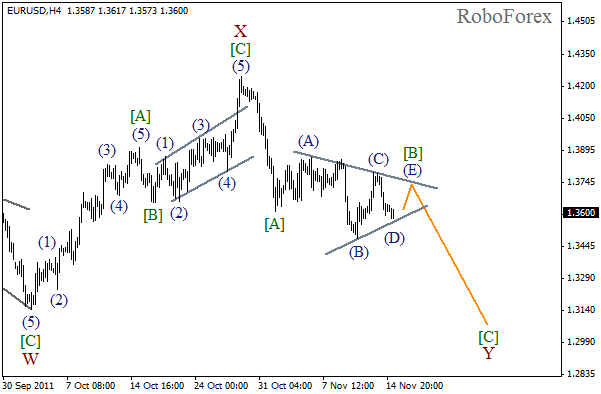
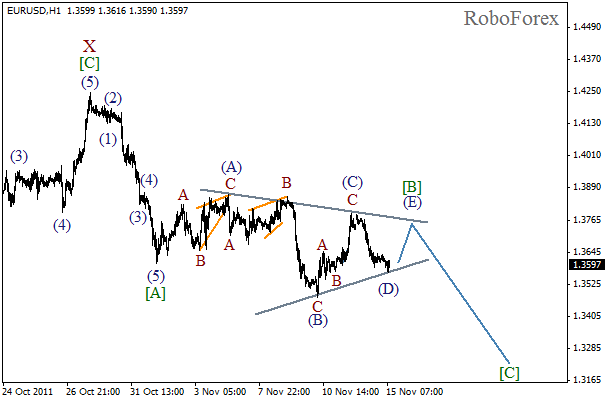
The structure of the above-mentioned triangle is shown on the H1 chart. Most likely, the price will make one last rapid movement upwards, and then start falling down. If the price reaches a new local minimum, the triangle scenario will be cancelled and the pair will start moving downwards immediately.
Attention!
Forecasts presented in this section only reflect the author’s private opinion and should not be considered as guidance for trading. RoboForex bears no responsibility for trading results based on trading recommendations described in these analytical reviews.