Wave Analysis 25.11.2013 (DJIA Index, Crude Oil)
25.11.2013
Analysis for November 25th, 2013
DJIA Index
Current chart structure implies that Index completed ascending impulse inside wave 1. It looks like on minor wave level price finished the fifth wave, which means that instrument may start forming the first bearish wave during Monday.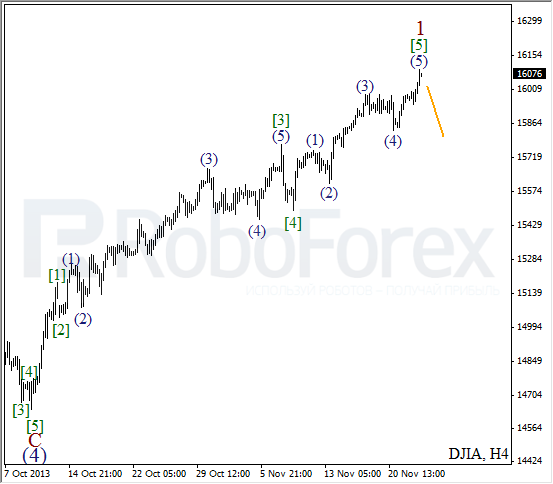
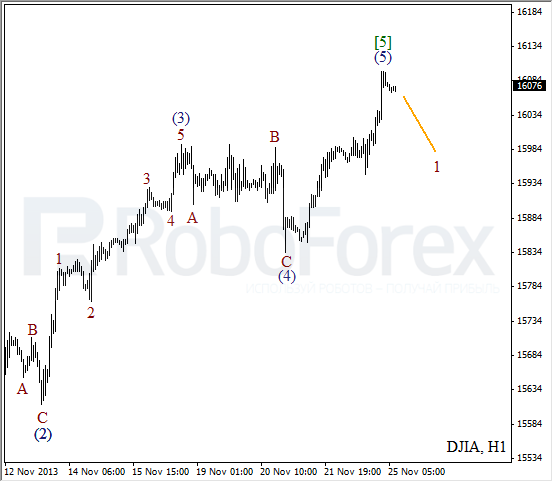
More detailed new wave structure is shown on H1 chart. After finishing wave (4) in the form of zigzag pattern, price formed ascending impulse inside wave (5). If later instrument forms initial descending impulse, price may reverse, or, at least, start new correction.
Crude Oil
Oil continues forming bearish impulse. It looks like price completed wave (4) and started falling down inside the fifth one. Later instrument is expected to break minimum of wave (3).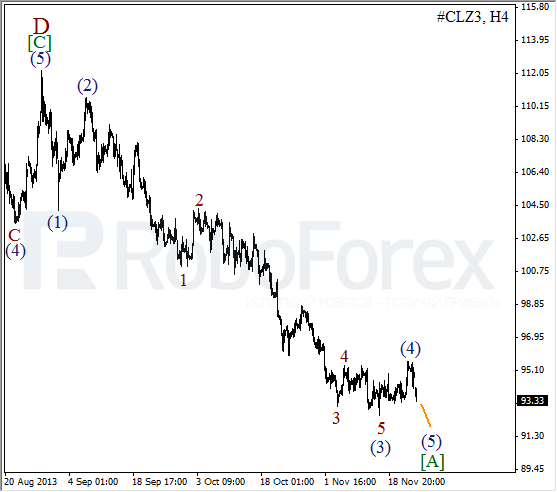
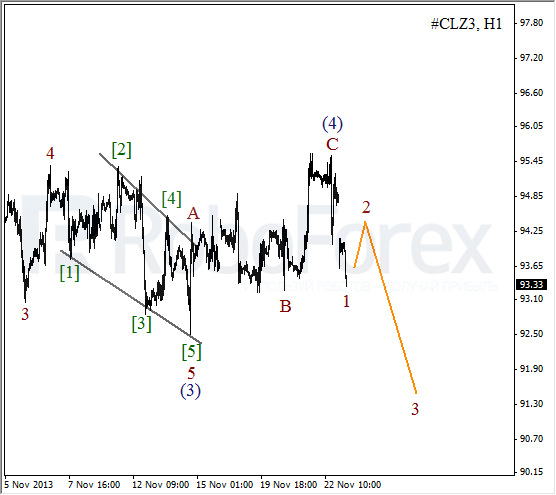
As we can see at the H1 chart, after completing diagonal triangle pattern inside wave 5 of (3), Oil formed zigzag pattern inside the fourth one. On minor wave level, instrument has already formed initial descending impulse and, after slight correction, is expected to continue moving downwards inside wave 3.
RoboForex Analytical Department
Attention!
Forecasts presented in this section only reflect the author’s private opinion and should not be considered as guidance for trading. RoboForex bears no responsibility for trading results based on trading recommendations described in these analytical reviews.