Wave Analysis 26.11.2012 (DJIA Index, Crude Oil)
26.11.2012
Analysis for November 26th, 2012
DJIA Index
It looks like the Index finishing zigzag pattern inside wave [2]. Earlier the price formed a descending wedge pattern inside the first wave. We can’t exclude a possibility that the instrument may start a new descending movement during the next several days..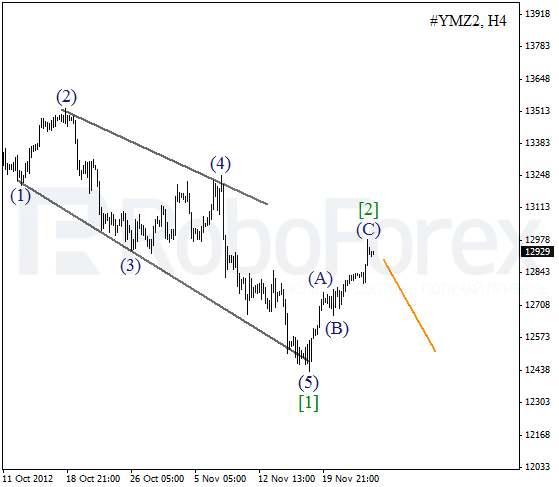
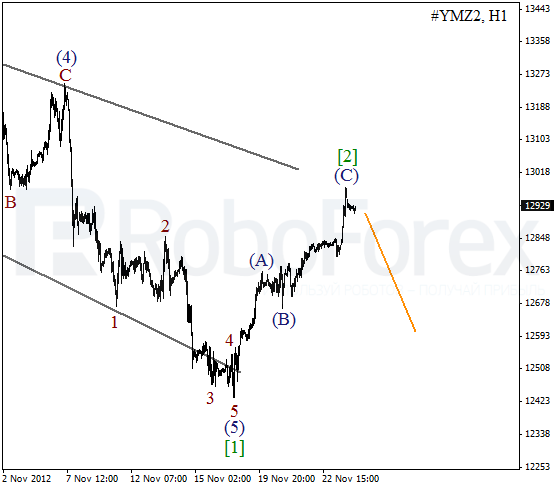
The current structure of the H1 chart implies that the Index completed forming a local correction. Later the market is expected to start a forming an initial descending impulse. In the future, during the formation of the second wave, one can try to open sell orders.
Crude Oil
It looks like the price finished wave (2) last week. Earlier the bears formed a descending wedge pattern. Most likely, the instrument will start moving downwards again and break the minimum of wave (1) by the end of the week.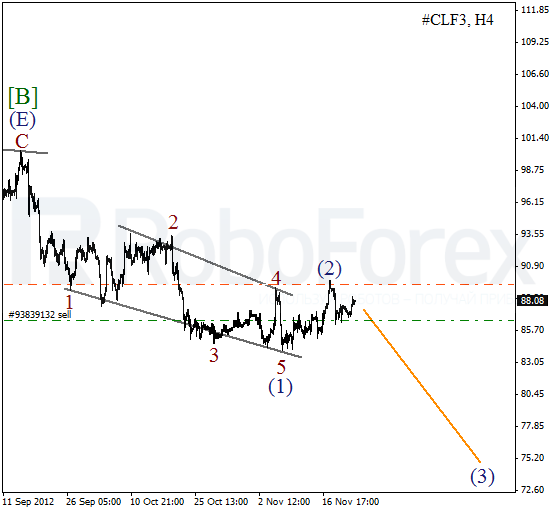
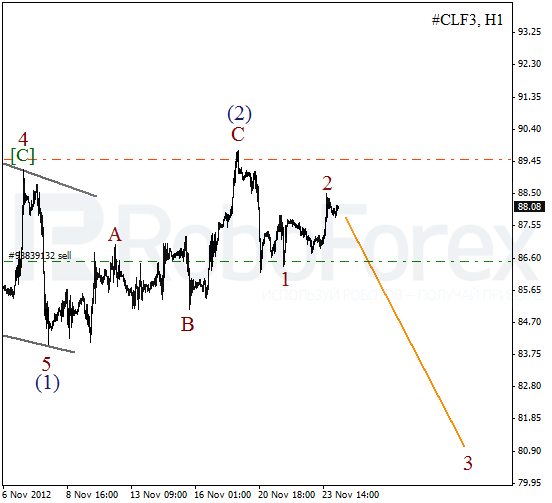
As we can see at the H1 chart, wave (2) was formed in the form of zigzag pattern. On the minor wave level Oil completed an initial impulse, and we may assume that a local correction was finished as well. In the near term, the instrument is expected to start a new descending movement inside wave 3.
RoboForex Analytical Department
Attention!
Forecasts presented in this section only reflect the author’s private opinion and should not be considered as guidance for trading. RoboForex bears no responsibility for trading results based on trading recommendations described in these analytical reviews.