Wave Analysis 27.11.2013 (DJIA Index, Crude Oil)
27.11.2013
Analysis for November 27th, 2013
DJIA Index
Current chart structure implies that Index completed bullish impulse inside wave 1. It looks like on minor wave level price finished wave [2] and right now is starting to reverse. Probably, bears may return to the market during the day.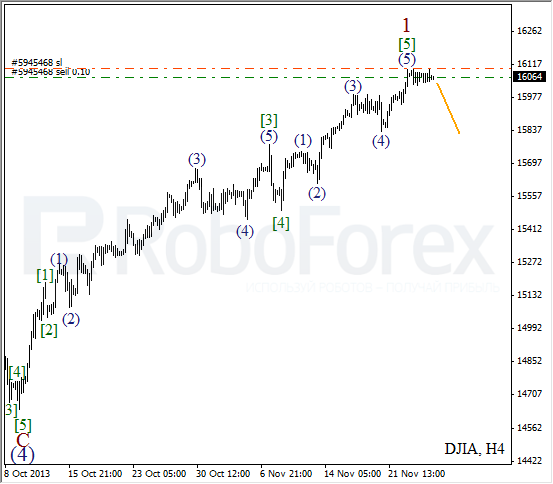
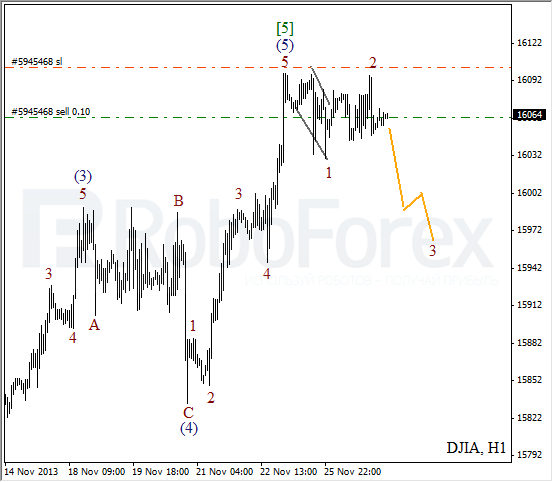
As we can see at the H1 chart, price formed descending wedge pattern inside wave 1. Possibly, instrument also formed zigzag pattern inside wave 2 and is about to start falling down inside the third one. During local correction, I opened sell order with stop placed a bit above maximum.
Crude Oil
Oil is still moving downwards; I’ve already moved stop on my sell order into the black. Earlier, after completing long extension inside the third wave, instrument finished wave (4). Price may break minimum during the day.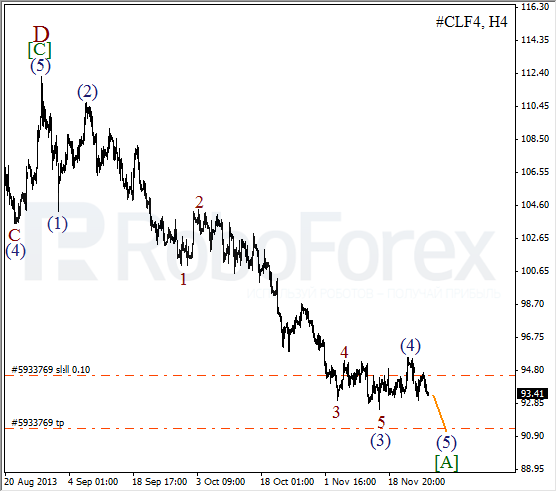
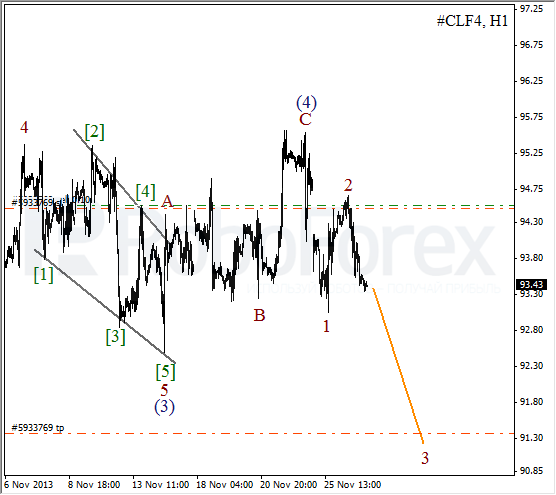
More detailed new wave structure is shown on H1 chart. Wave (4) took the form of zigzag pattern and then price completed initial impulse inside wave 1. While forming wave 2, instrument has eliminated the gap occurred during the market opening on Monday. In the near term, I expect price to continue falling down inside wave 3 of (5).
RoboForex Analytical Department
Attention!
Forecasts presented in this section only reflect the author’s private opinion and should not be considered as guidance for trading. RoboForex bears no responsibility for trading results based on trading recommendations described in these analytical reviews.