Wave Analysis 03.12.2013 (DJIA Index, Crude Oil)
03.12.2013
Analysis for December 3rd, 2013
DJIA Index
Index is being corrected, just as we expected. Price may complete wave (4) during the day, that’s why I’m keeping my buy order. In the future, instrument may break maximum of wave (3) of [5].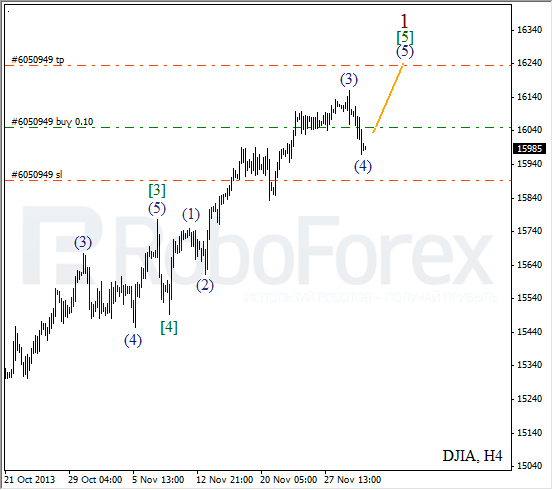
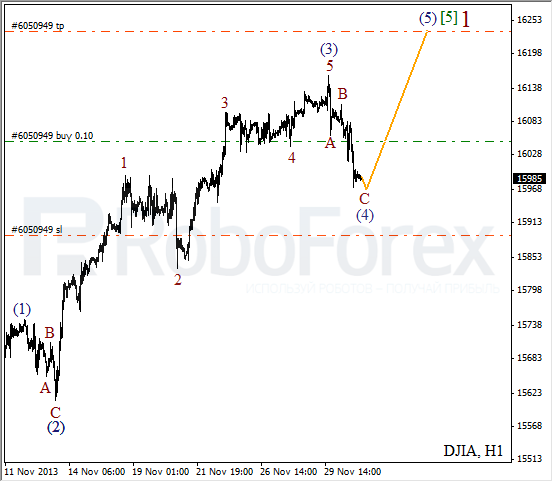
More detailed new wave structure is shown on H1 chart. Probably, the fourth wave is taking the form of zigzag pattern. In the near term, price may complete wave C of (4) and start forming initial ascending impulse inside the fifth one.
Crude Oil
Main scenario still implies that Oil is going to continue falling down. Probably, the fifth wave is taking the form of diagonal triangle pattern. In the future, instrument is expected to start new descending movement and break minimum.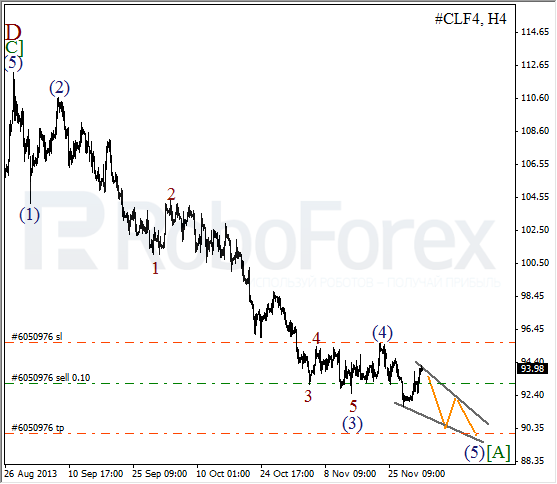
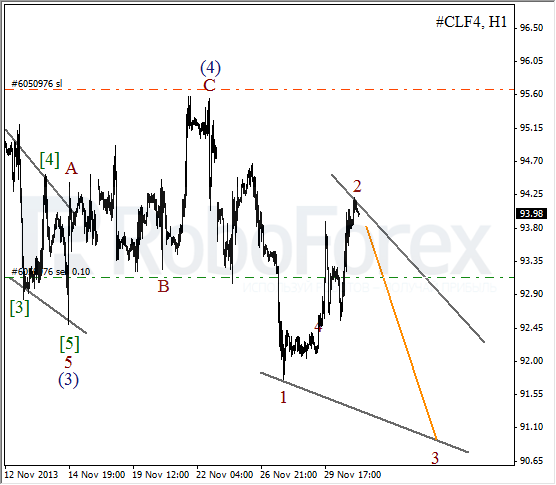
As we can see at the H1 chart, instrument is completing the second wave inside diagonal triangle pattern. In the future, after price forms the first wave inside wave 3, I’ll open another sell order.
RoboForex Analytical Department
Attention!
Forecasts presented in this section only reflect the author’s private opinion and should not be considered as guidance for trading. RoboForex bears no responsibility for trading results based on trading recommendations described in these analytical reviews.