Japanese Candlesticks Analysis 23.08.2022 (XAUUSD, NZDUSD, GBPUSD)
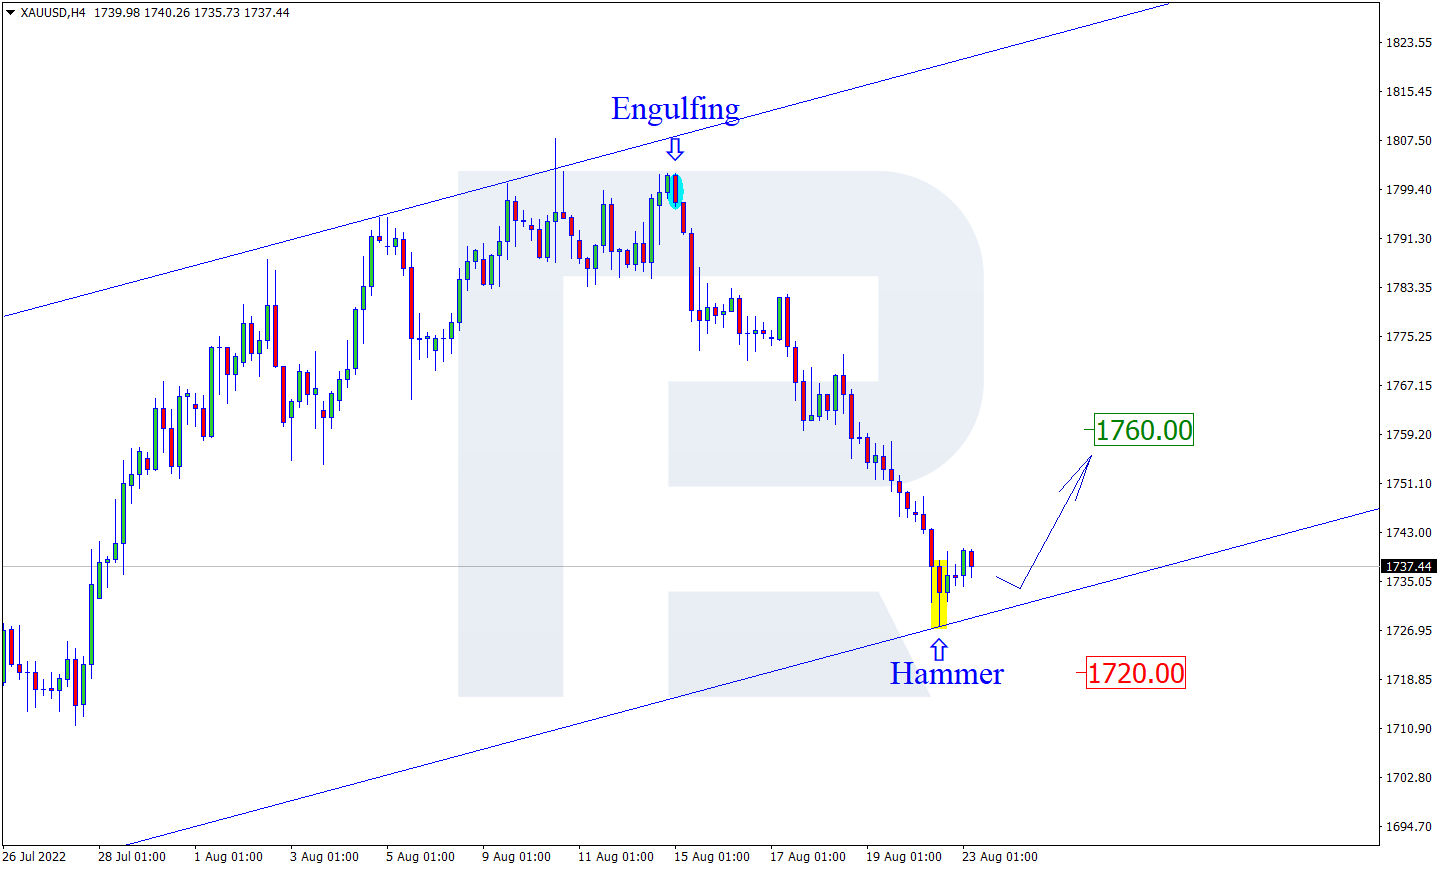
XAUUSD, “Gold vs US Dollar”
As we can see in the H4 chart, XAUUSD has formed a Hammer reversal pattern not far from the support area. At the moment, the asset may reverse in the form of a new ascending impulse. In this case, the upside target may be at 1760.00. At the same time, the opposite scenario implies that the price may correct to reach 1720.00 first and then resume trading upwards.

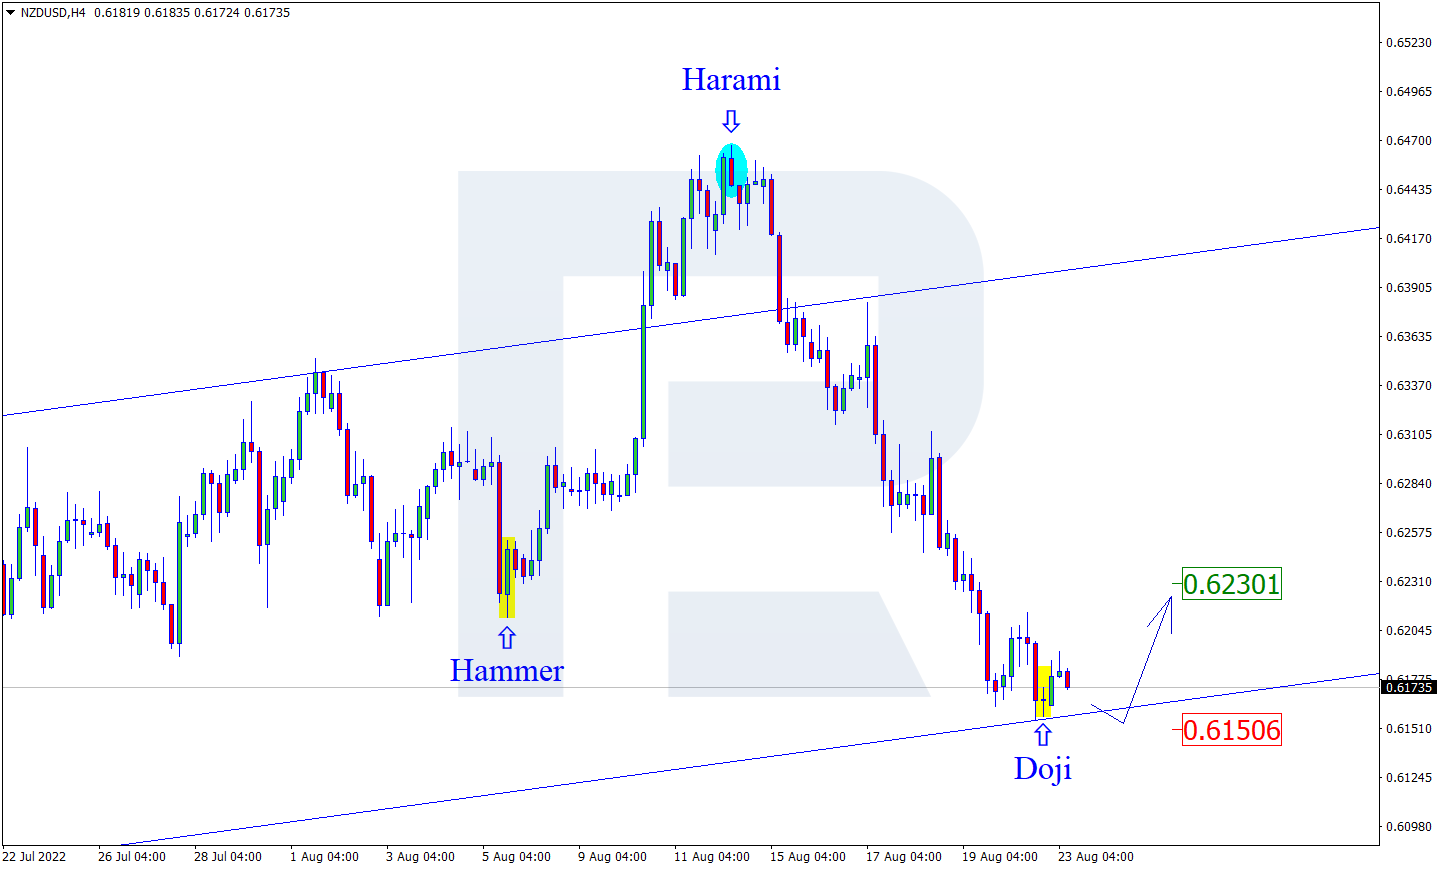
NZDUSD, “New Zealand vs US Dollar”
As we can see in the H4 chart, NZDUSD has formed a Doji reversal pattern close to the support area. At the moment, the asset is reversing in the form of another rising impulse. In this case, the upside target may be at 0.6230. After that, the asset may break the resistance level and continue moving upwards. However, an alternative scenario implies that the price may correct to reach 0.6150 before resuming the uptrend.
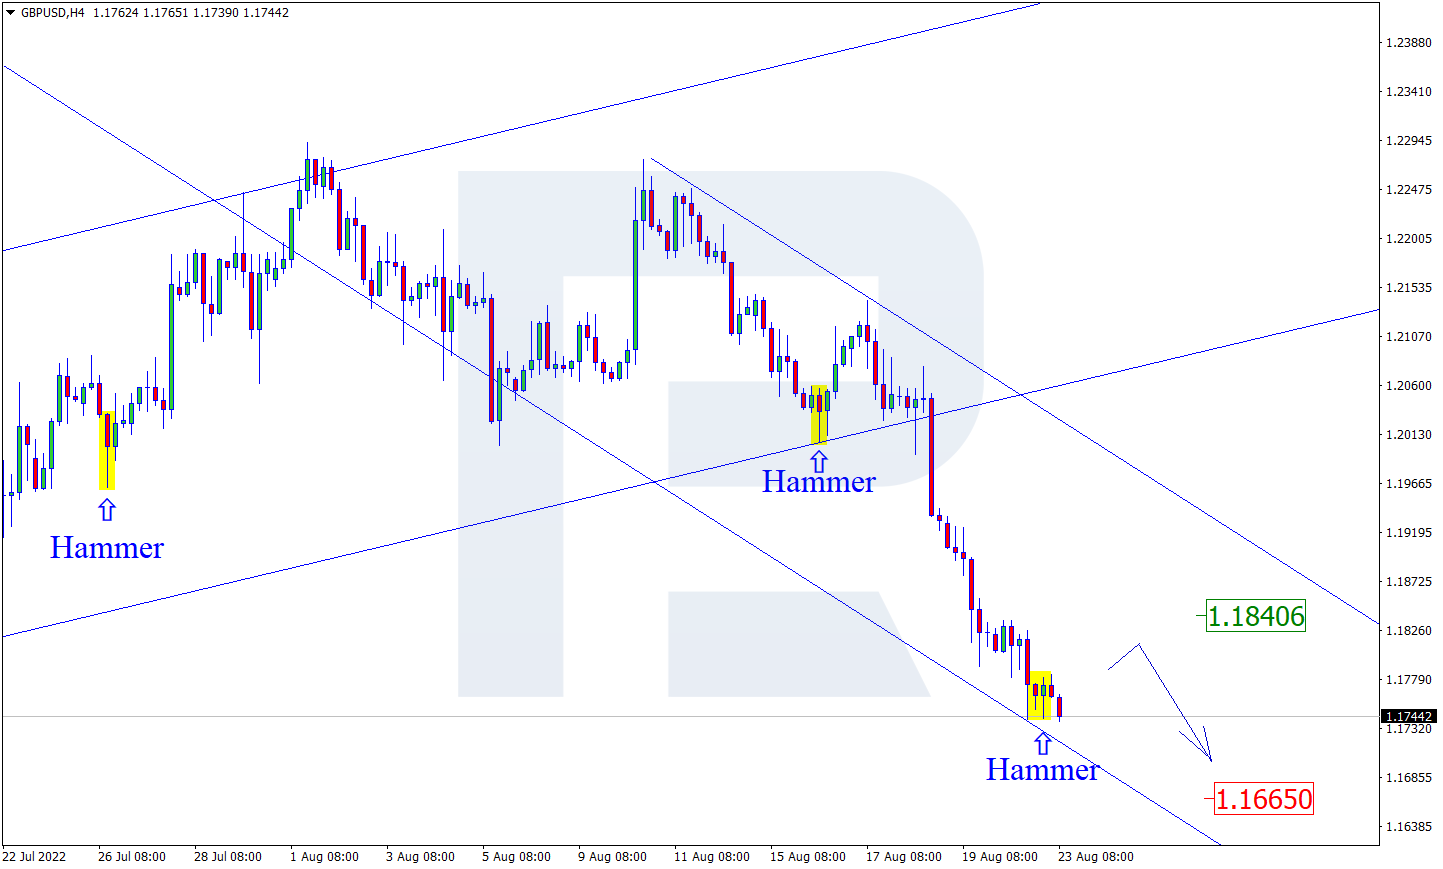
GBPUSD, “Great Britain Pound vs US Dollar”
As we can see in the H4 chart, GBPUSD has formed a Hammer reversal pattern near the support level. At the moment, the pair may reverse in the form of a new ascending impulse. In this case, the upside target may be the resistance area at 1.1840. Later, the market may rebound from this level and resume falling. Still, there might be an alternative scenario, in which the asset may continue falling to reach the support level at 1.1665 without any corrections.
Forecasts presented in this section only reflect the author’s private opinion and should not be considered as guidance for trading. RoboForex bears no responsibility for trading results based on trading recommendations described in these analytical reviews.