Fibonacci Retracements Analysis 02.04.2019 (EURUSD, USDJPY)
EURUSD, “Euro vs US Dollar”
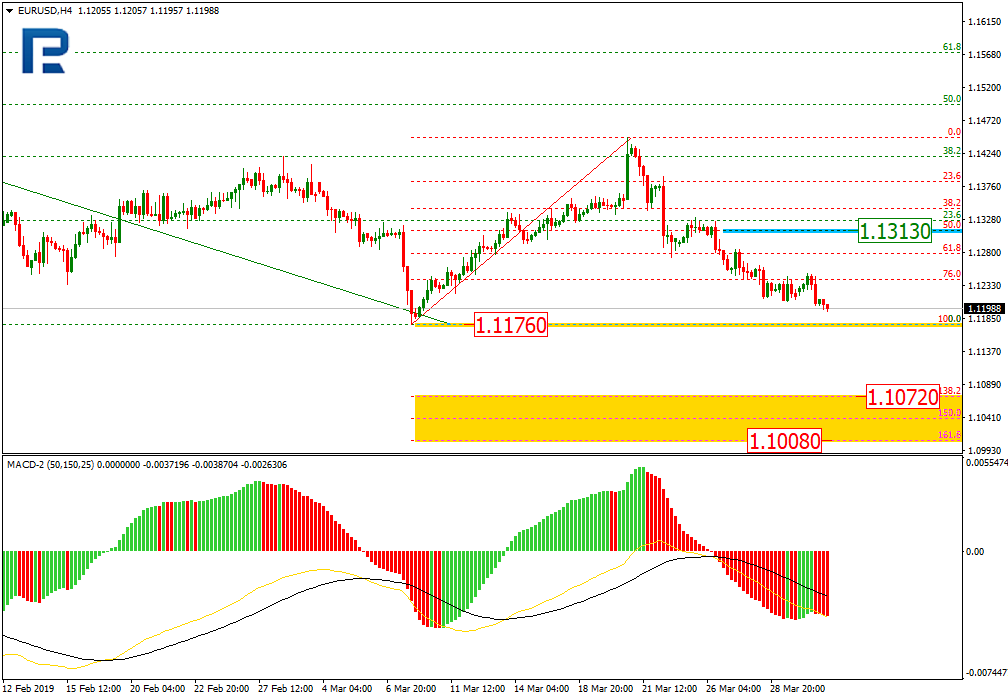
As we can see in the H4 chart, EURUSD is forming a new descending wave, which is getting closer to the low at 1.1176. If the price breaks it, the instrument may continue trading downwards to reach the post-correctional extension area between the retracements of 138.2% and 161.8% at 1.1072 and 1.1008 respectively.

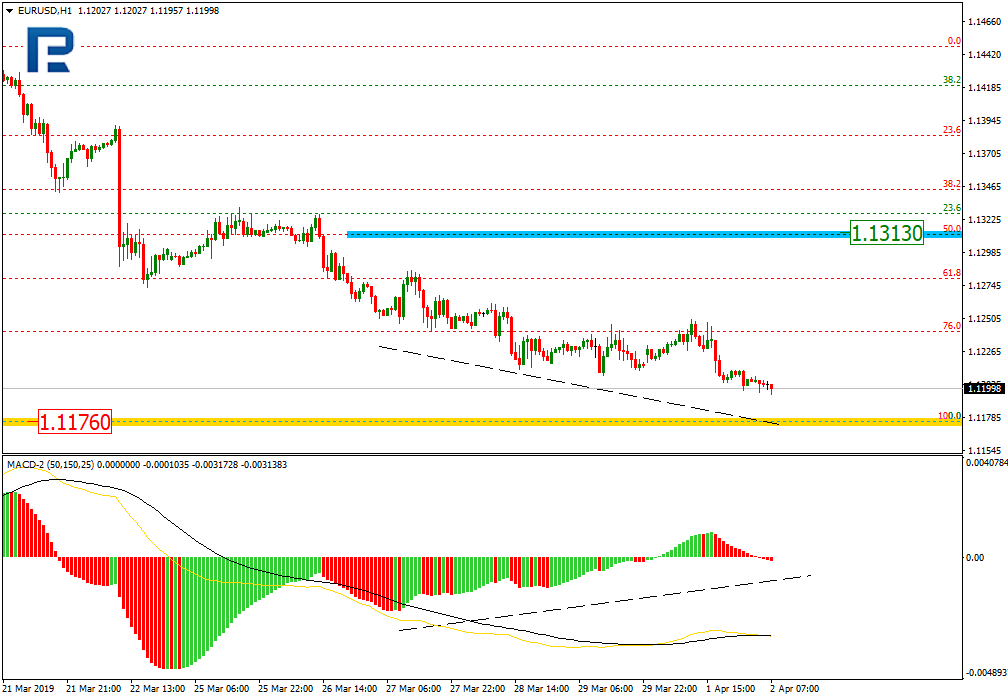
In the H1 chart, the downtrend continues; it has almost reached the support level. At the same time, there is a convergence on MACD, which may indicate a new pullback after the price reaches the low.
USDJPY, “US Dollar vs. Japanese Yen”
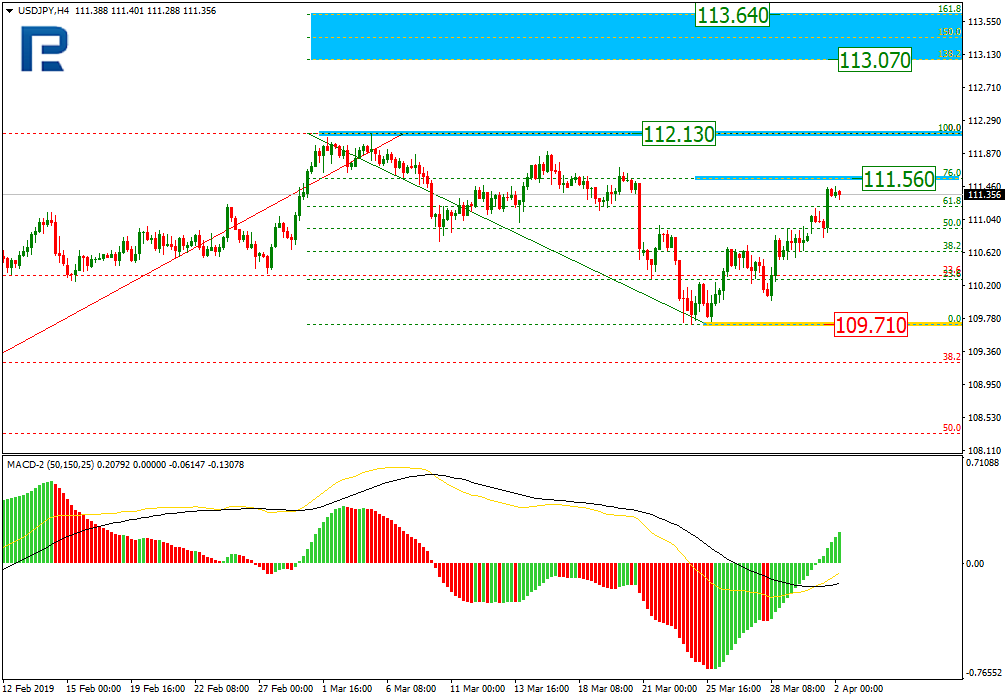
In the H4 chart, USDJPY is forming a new ascending impulse, which is getting closer to the retracement of 76.0% at 111.56. The next target may be the mid-term high at 112.13. If the price breaks it, the instrument may continue trading upwards to reach the post-correctional extension area between the retracements of 138.2% and 161.8% at 113.07 and 113.64 respectively. The support level is at 109.71.
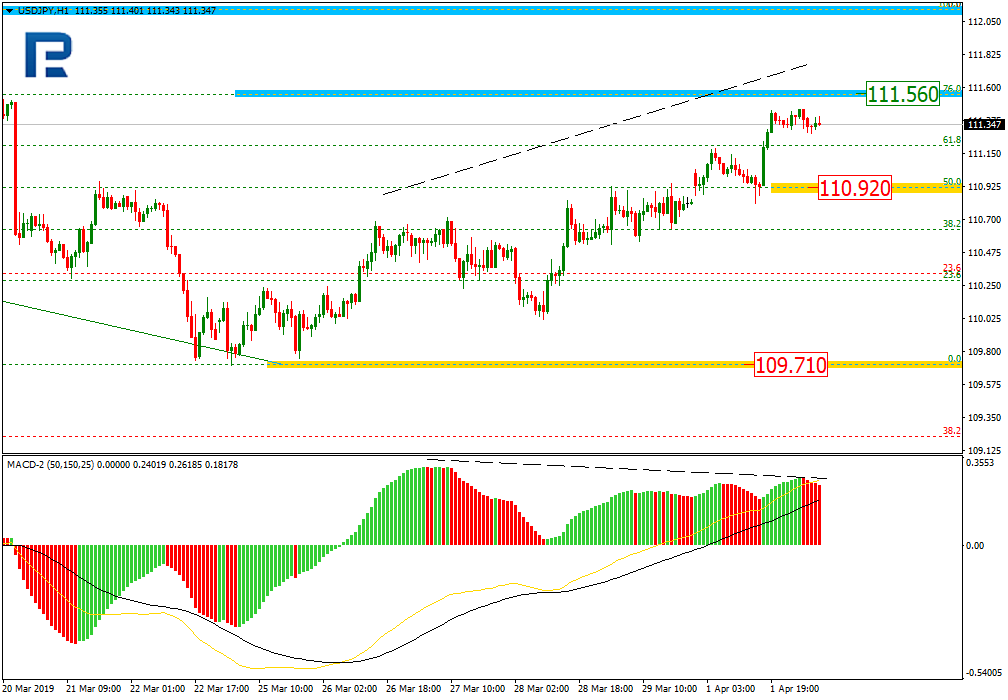
As we can see in the H1 chart, the pair is getting closer to the retracement of 76.0% and may later reach the high. There is a divergence on the Oscillator, which may indicate a possible correction with the target at the retracement of 50.0% at 110.92.
Forecasts presented in this section only reflect the author’s private opinion and should not be considered as guidance for trading. RoboForex bears no responsibility for trading results based on trading recommendations described in these analytical reviews.