Fibonacci Retracements Analysis 04.02.2020 (EURUSD, USDJPY)
EURUSD, “Euro vs US Dollar”
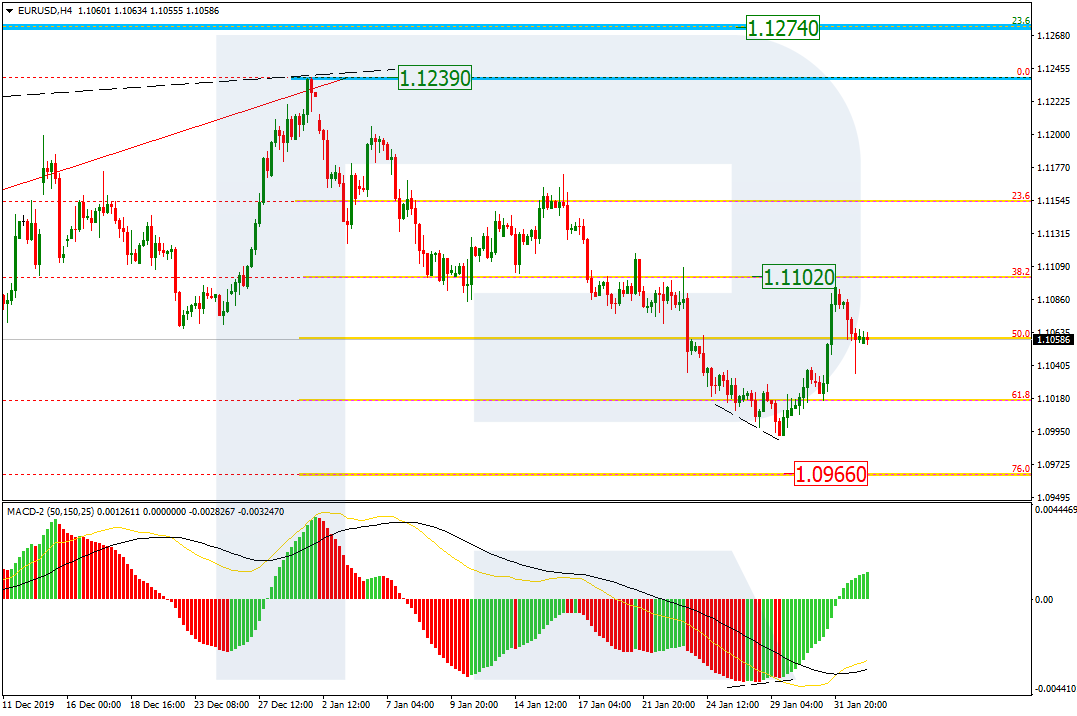
As we can see in the H4 chart, the convergence made the pair complete correctional downtrend at 61.8% fibo and start a new rising impulse. However, it won’t be wise to consider the mid-term tendency reverse as long as the price is moving below the resistance, which is 38.2% fibo at 1.1102. still, if the price breaks this level, the instrument may reach the high at 1.1239 and then the long-term correctional target at 23.6% fibo (1.1274).

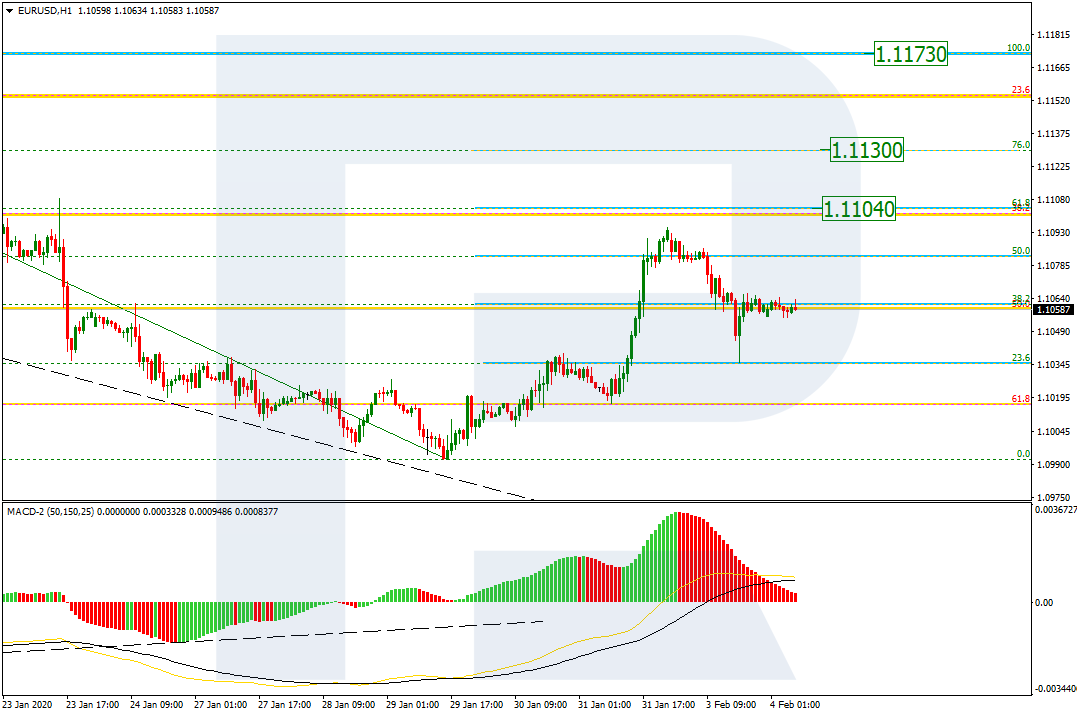
The H1 chart shows more detailed structure of the current growth after the convergence. After growing and reaching 50.0% fibo, the pair has completed a new pullback to the downside. In the nearest future, the instrument is expected to start another rising impulse. The targets may be 61.8 and 76.0% fibo at 1.1104 and 1.1130 respectively, as well as the fractal high at 1.1173.
USDJPY, “US Dollar vs. Japanese Yen”
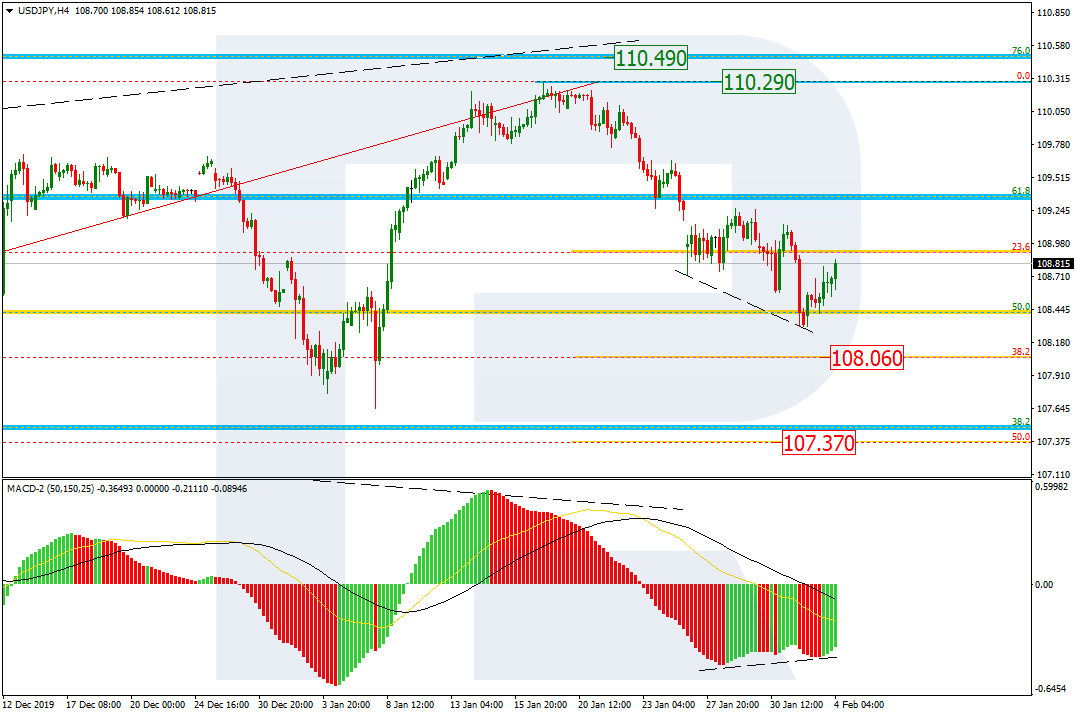
As we can see in the daily chart, the divergence made USDJPY finish its decline by testing the long-term support at 50.0% fibo and start a new pullback. After completing the pullback, the instrument may resume falling to reach 38.2% and 50.0% fibo at 108.06 and 107.37 respectively. The resistance is the high at 110.29.
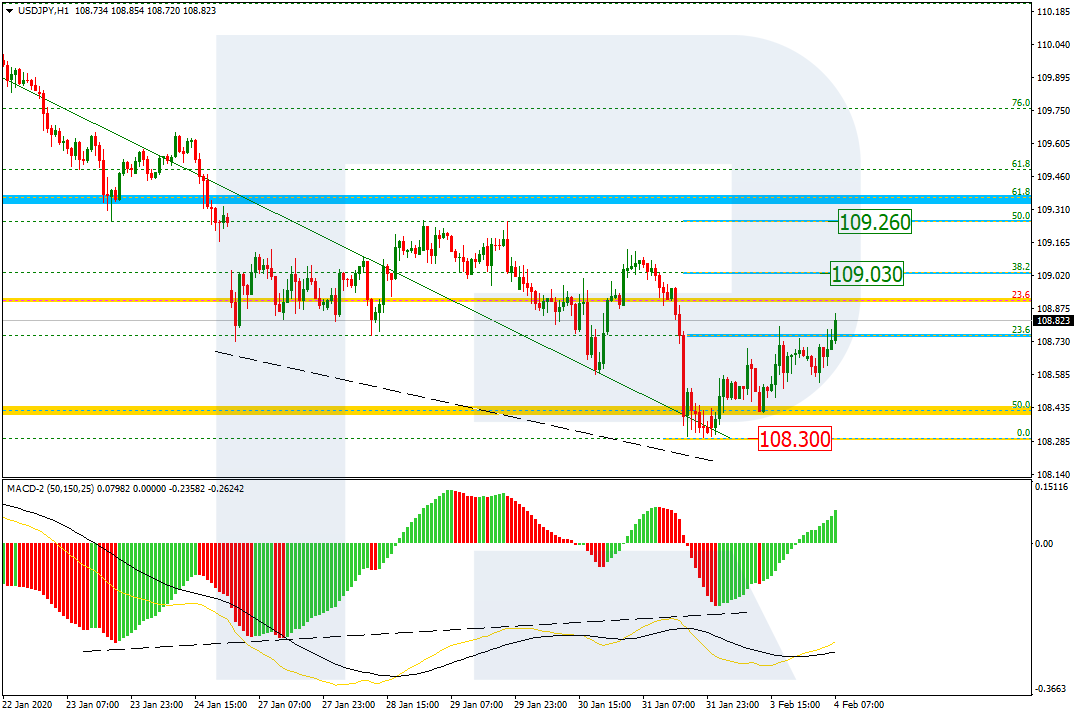
The H1 chart shows that the pair is growing; it has already reached 23.6% fibo. The next upside targets may be 38.2% and 50.0% fibo at 109.03 and 109.26 respectively. The support is the low at 108.30.
Forecasts presented in this section only reflect the author’s private opinion and should not be considered as guidance for trading. RoboForex bears no responsibility for trading results based on trading recommendations described in these analytical reviews.