Fibonacci Retracements Analysis 04.04.2019 (AUDUSD, USDCAD)
AUDUSD, “Australian Dollar vs US Dollar”
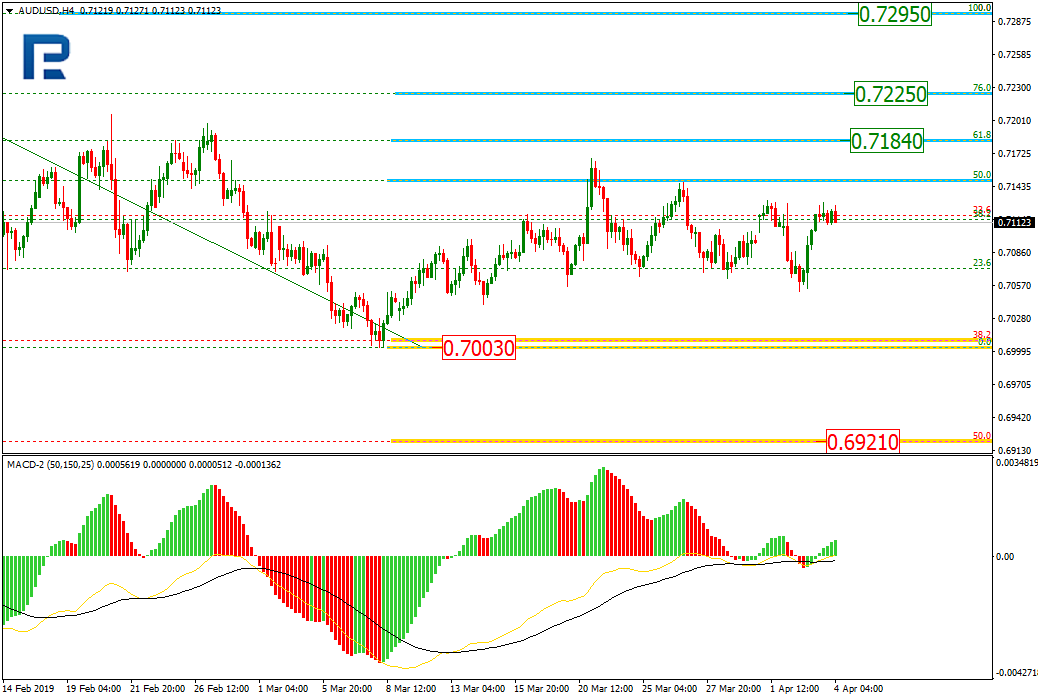
As we can see in the H4 chart, the correction continues; it has already reached the retracement of 50.0%. The next upside targets may be the retracements of 61.8% and 76.0% at 0.7184 and 0.7225 respectively, and then the high 0.7295. The support level is the low at 0.7003. If the price breaks it, the instrument may continue falling towards the mid-term retracement of 50.0% at 0.6921.

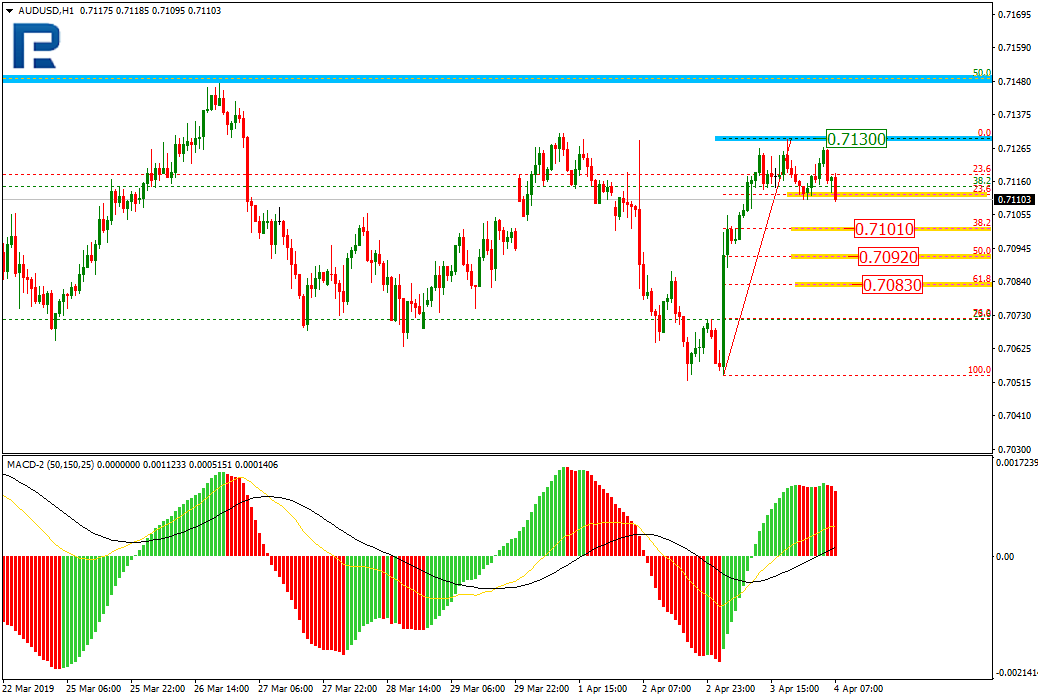
In the H1 chart, after finishing the ascending impulse, the pair is being corrected to reach the retracements of 38.2%, 50.0%, and 61.8% at 0.7101, 0.7092, and 0.7083 respectively. The resistance level is the local high at 0.7130.
USDCAD, “US Dollar vs Canadian Dollar”
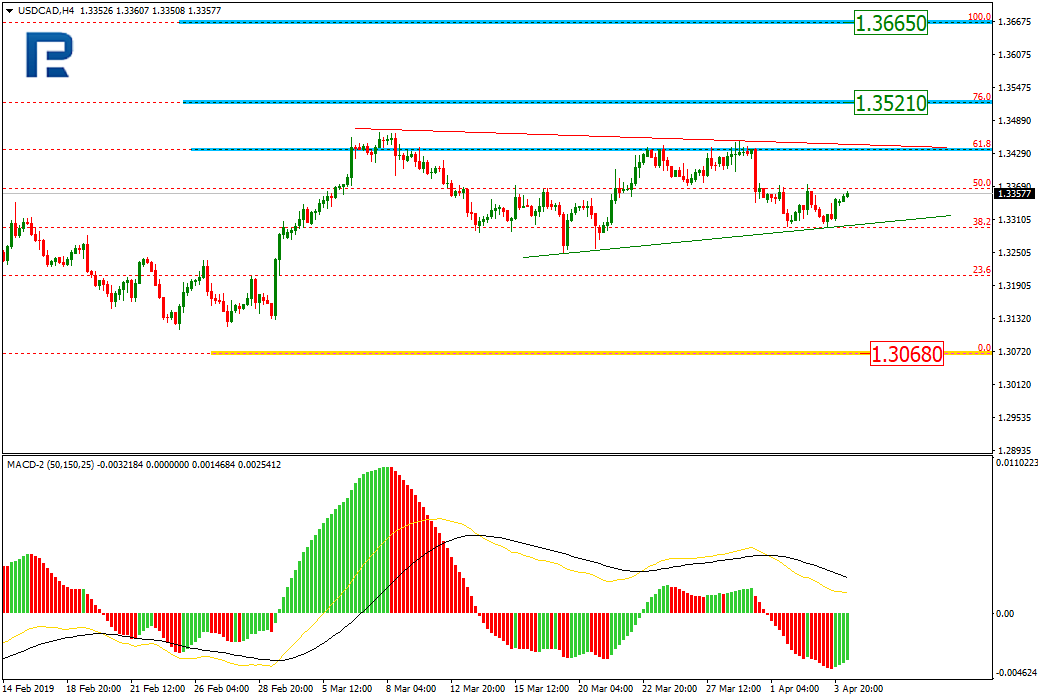
As we can see in the H4 chart, after reaching the retracement of 61.8%, the correctional is transforming into the Triangle. If the price breaks the pattern upwards, the instrument may continue growing to reach the retracement of 76.0% at 1.3521 and then the high at 1.3665.
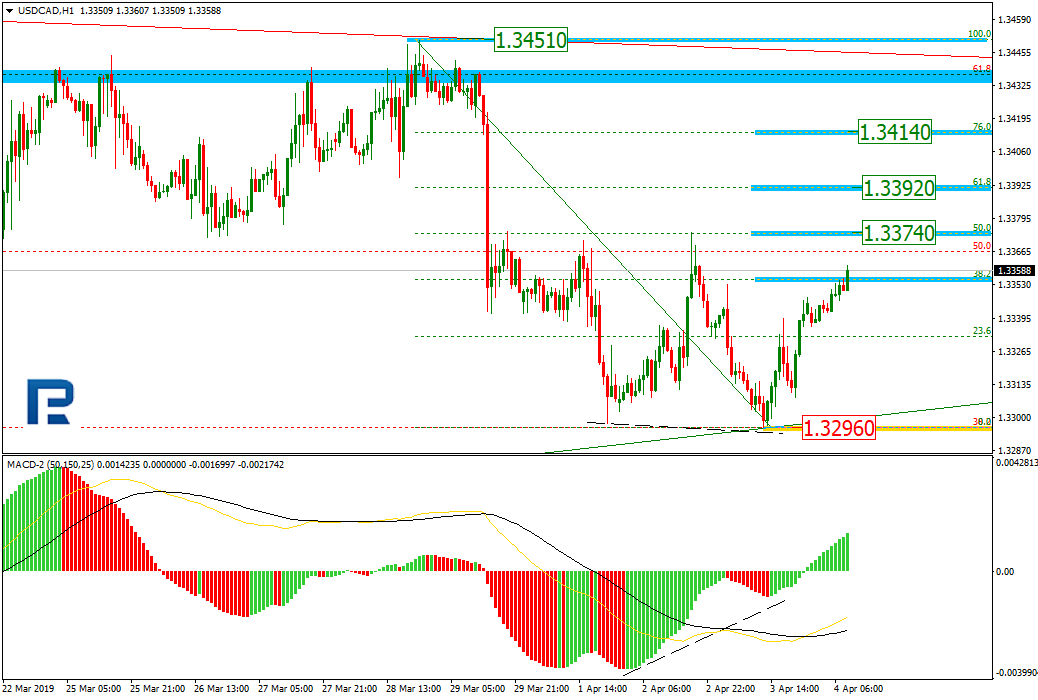
In the H1 chart, USDCAD is trading upwards and heading towards the retracements of 50.0%, 61.8%, and 76.0% at 1.3374, 1.3392, and 1.3414 respectively. The support level is the low at 1.3296.
Forecasts presented in this section only reflect the author’s private opinion and should not be considered as guidance for trading. RoboForex bears no responsibility for trading results based on trading recommendations described in these analytical reviews.