Fibonacci Retracements Analysis 09.05.2019 (AUDUSD, USDCAD)
AUDUSD, “Australian Dollar vs US Dollar”
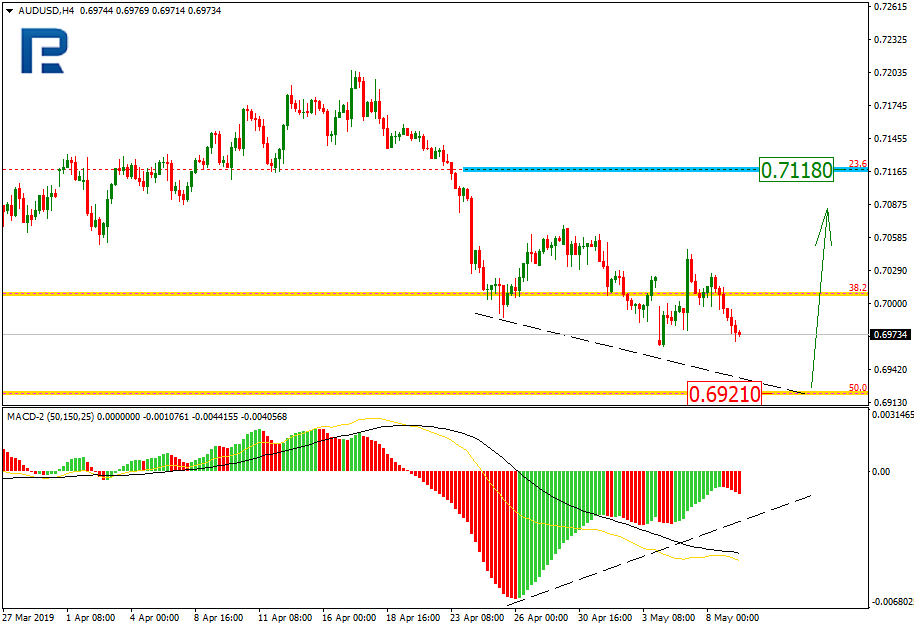
As we can see in the H4 chart, after breaking the retracement of 38.2%, the mid-term descending correction continues towards the retracement of 50.0% at 0.6921. At the same time, there is a convergence on MACD, which may indicate a possible pullback after the price reaches its target. The resistance is at 0.7118.

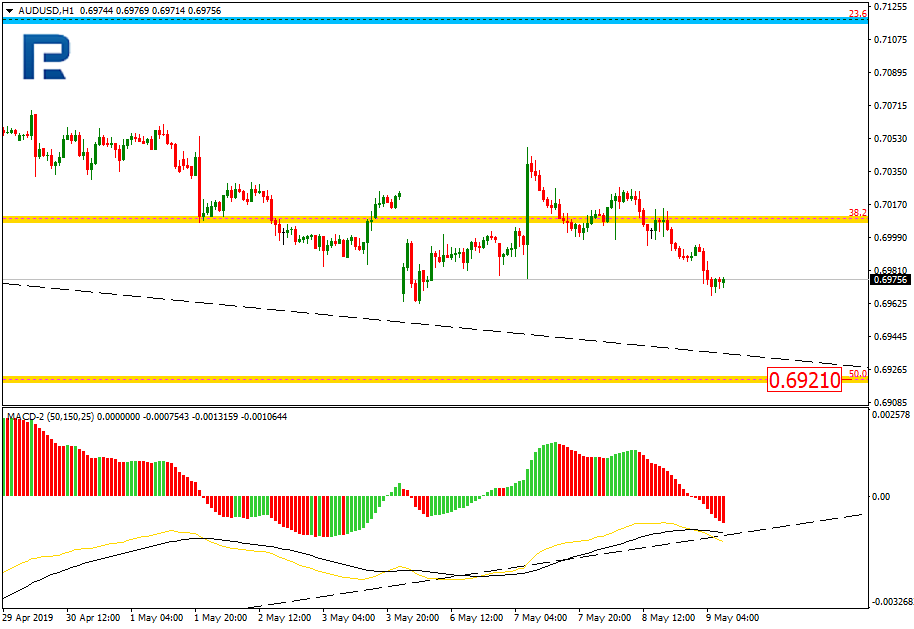
In the H1 chart, AUDUSD is getting closer to the local low. The key downside target is the retracement of 50.2% at 0.6921.
USDCAD, “US Dollar vs Canadian Dollar”
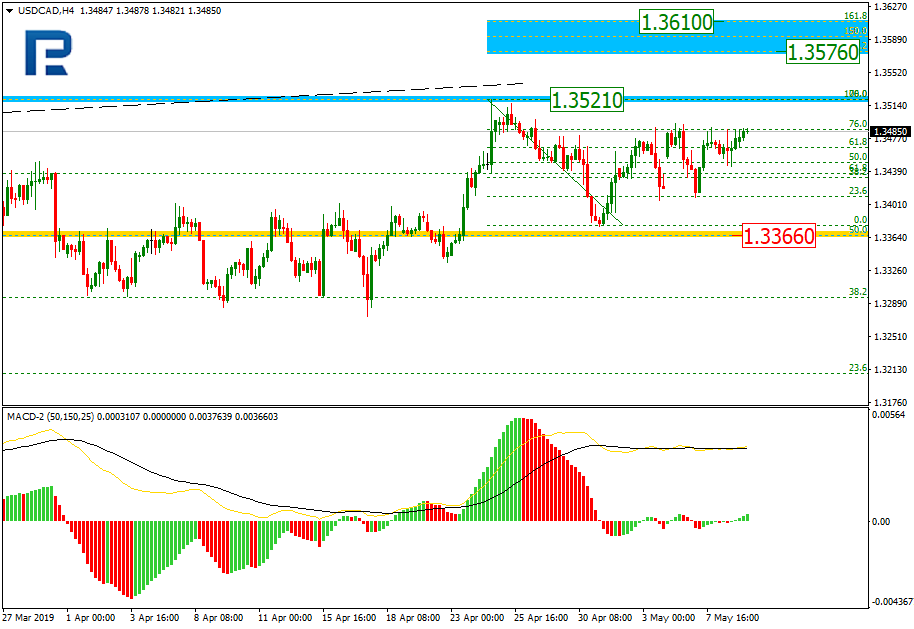
As we can see in the H4 chart, there was a divergence on MACD, which made the pair start a new rising wave. The target of this wave is the retracement of 76.0% at 1.3521. After breaking this level, the instrument may continue growing towards the post-correctional extension area between the retracements of 138.2% and 161.8% at 1.3576 and 1.3610 respectively. The key support level is the retracement of 50.0% at 1.3366.
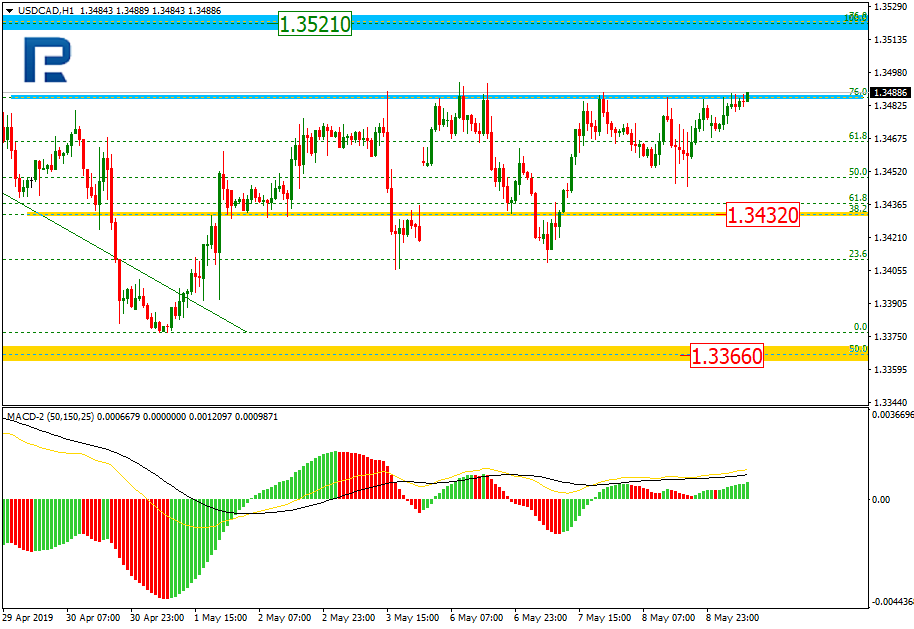
In the H1 chart, USDCAD is still trading upwards and getting ready to test the retracement of 76.0% once again. If the price breaks it, the instrument may continue growing to reach the high at 1.3521. The support level is the retracement of 38.2% at 1.3432.
Forecasts presented in this section only reflect the author’s private opinion and should not be considered as guidance for trading. RoboForex bears no responsibility for trading results based on trading recommendations described in these analytical reviews.