Fibonacci Retracements Analysis 11.06.2020 (AUDUSD, USDCAD)
AUDUSD, “Australian Dollar vs US Dollar”
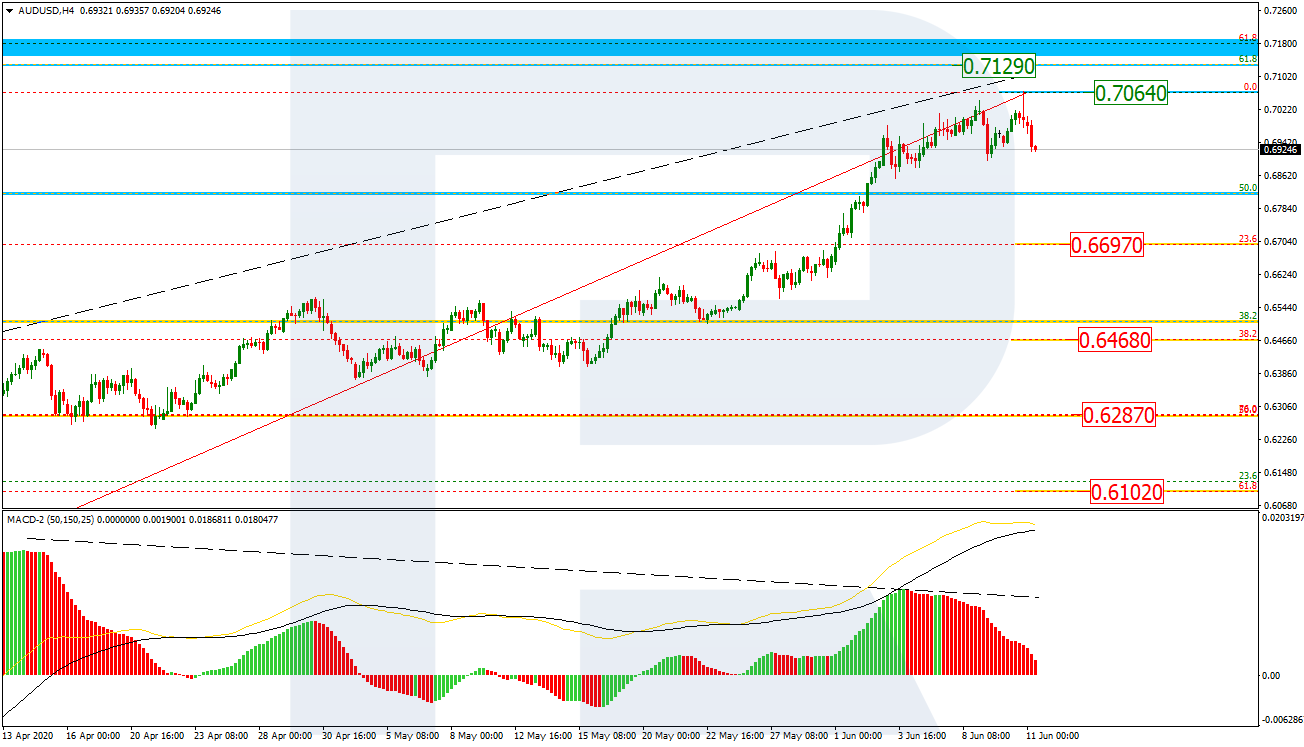
As we can see in the H4 chart, AUDUSD has got very close to 61.8% fibo at 0.7129 but the divergence on MACD indicates that the uptrend is over. In the short-term, one can expect the pair to fall towards 23.6%, 38.2%, 50.0%, and 61.8% fibo at 0.6697, 0.6484, 0.6287, and 0.6102 respectively. If the pair breaks the resistance at 0.7064, the instrument may resume the uptrend.

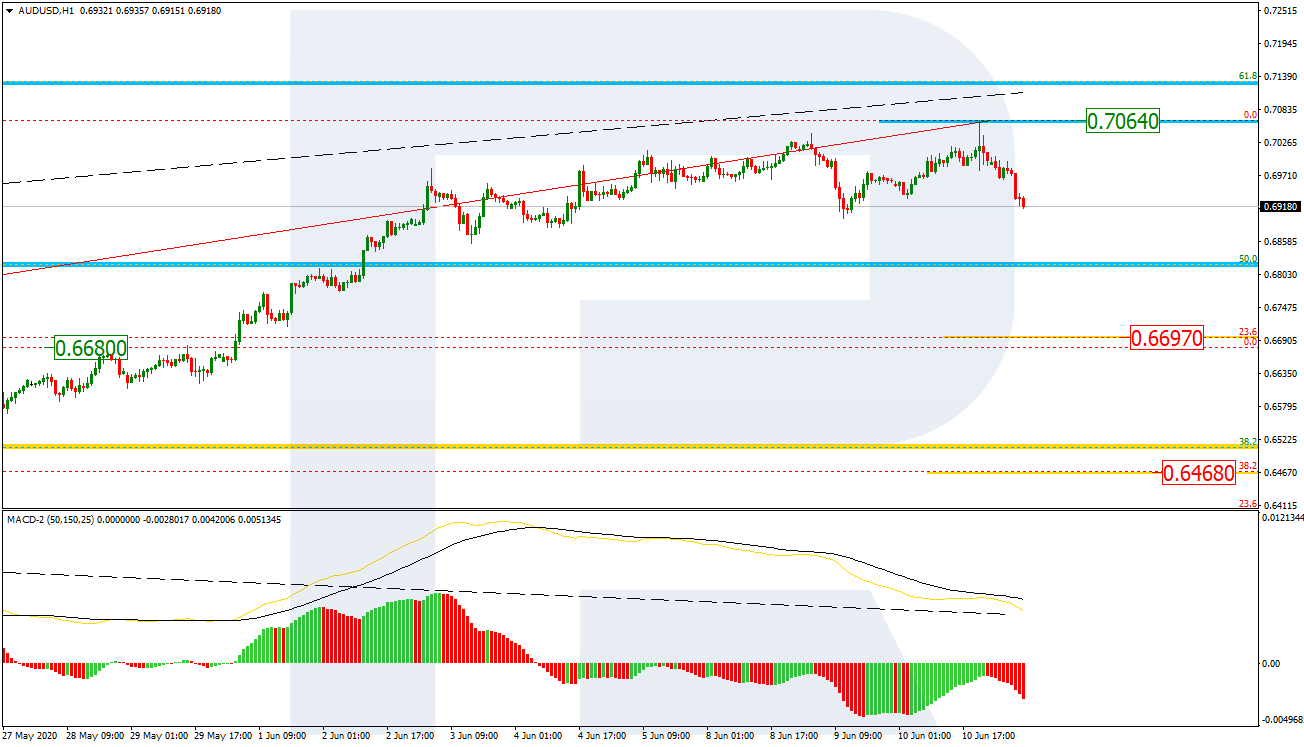
The H1 chart shows a more detailed structure of the trend reversal after the divergence on MACD. The closest downside targets may be at 23.6% and 38.2% fibo at 0.6697 and 0.6484 respectively.
USDCAD, “US Dollar vs Canadian Dollar”
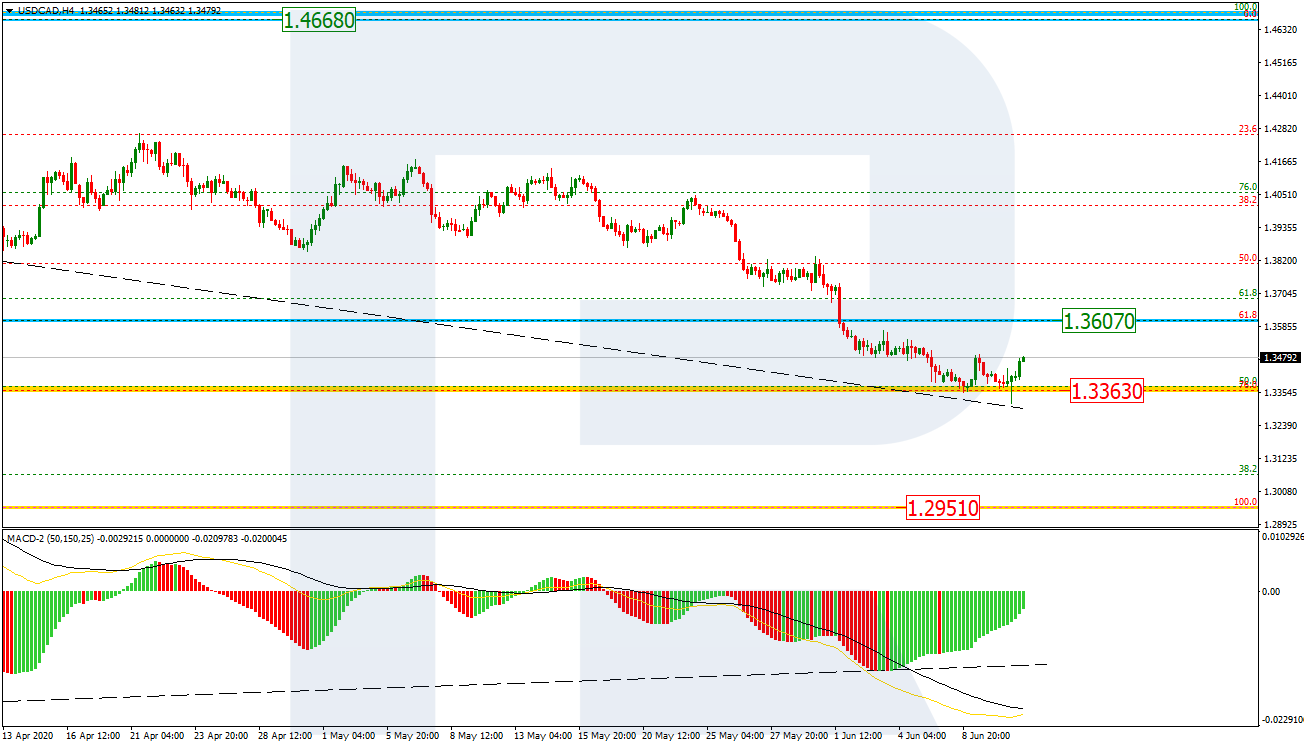
As we can see in the H4 chart, the descending wave has tested 76.0% fibo while MACD is forming a convergence, which may indicate a possible trend reversal. If the price breaks the current resistance at 61.8% fibo (1.3607), USDCAD will reverse and start a new rising wave to reach the high at 1.4668.
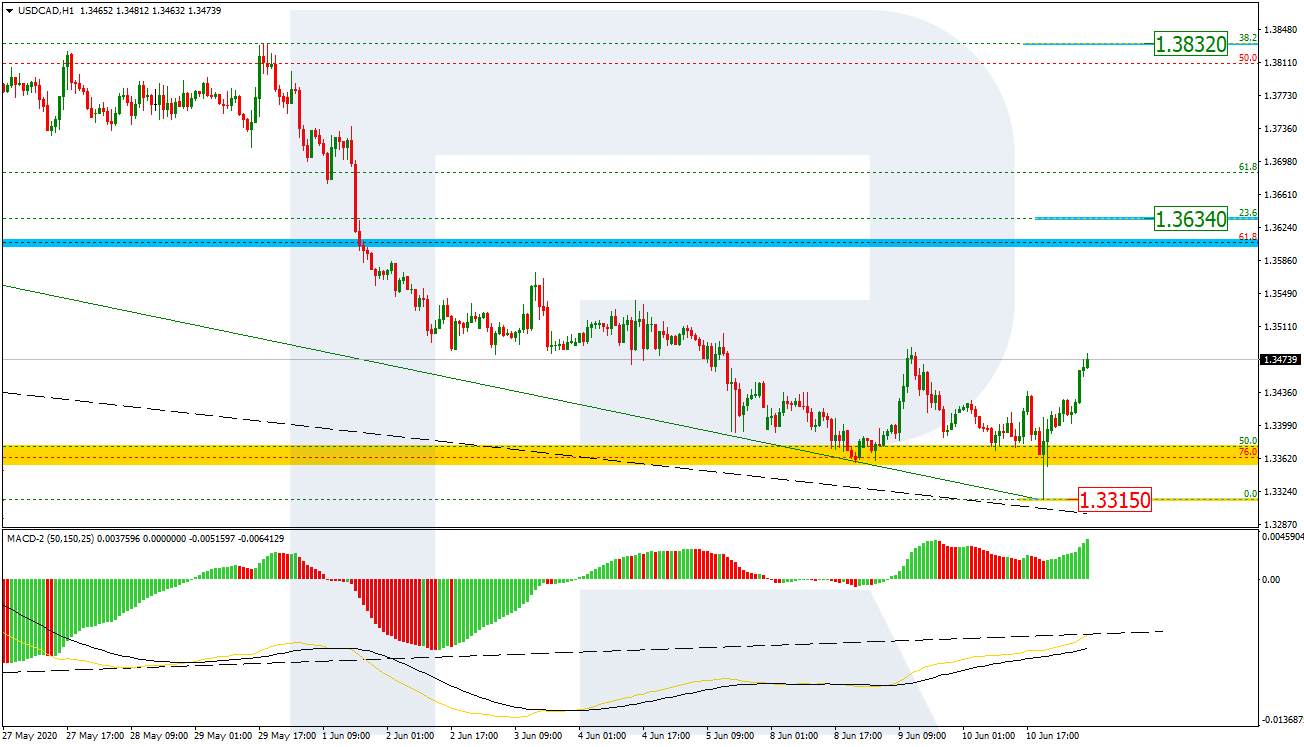
In the H1 chart, there is a convergence on MACD and the pair is reversing to start a new growth. The closest upside targets may be 23.6% and 38.2% fibo at 1.3634 and 1.3832 respectively. The support is the low at 1.3315.
Forecasts presented in this section only reflect the author’s private opinion and should not be considered as guidance for trading. RoboForex bears no responsibility for trading results based on trading recommendations described in these analytical reviews.