Fibonacci Retracements Analysis 24.04.2019 (GBPUSD, EURJPY)
GBPUSD, “Great Britain Pound vs US Dollar”
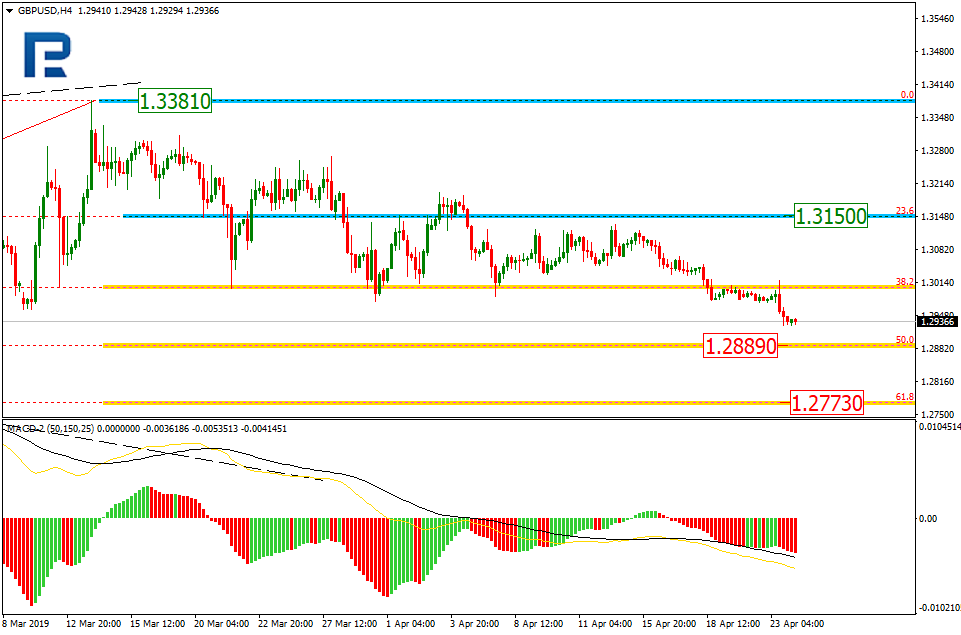
As we can see in the H4 chart, the downtrend continues. GBPUSD has broken the Triangle pattern to the downside; right now, it is trading towards the retracements of 50.0% and 61.8% at 1.2889 and 1.2773 respectively. The resistance level is the retracement of 23.6% at 1.3150.

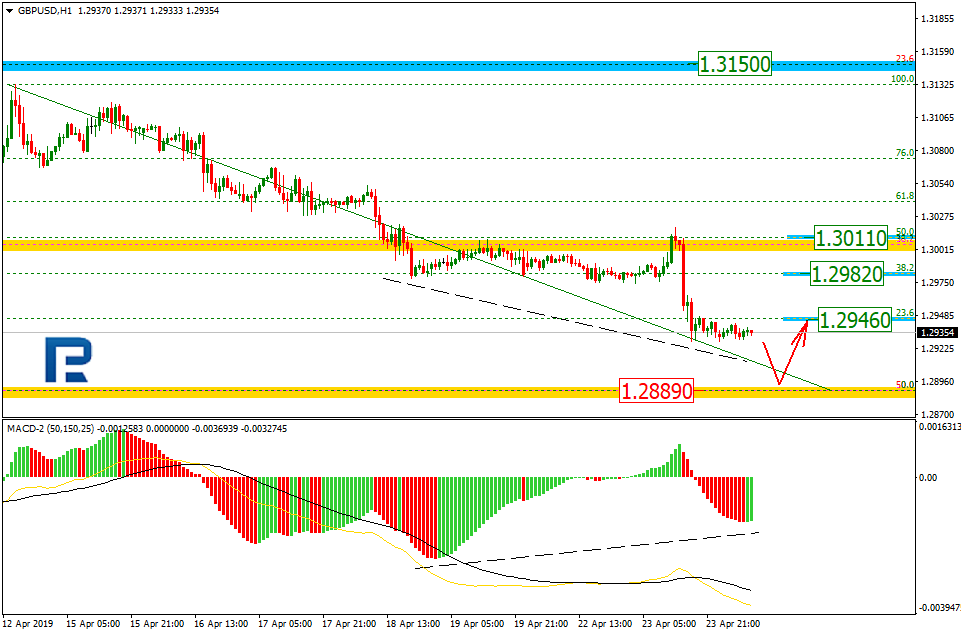
In the H1 chart, the price is falling. At the same time, there is a convergence on MACD, that’s why the pair is expected to start a new pullback towards the retracements of 23.6%, 38.2%, and 50.0% at 1.2946, 1.2982, and 1.3011 respectively after it reaches 1.2889.
EURJPY, “Euro vs. Japanese Yen”
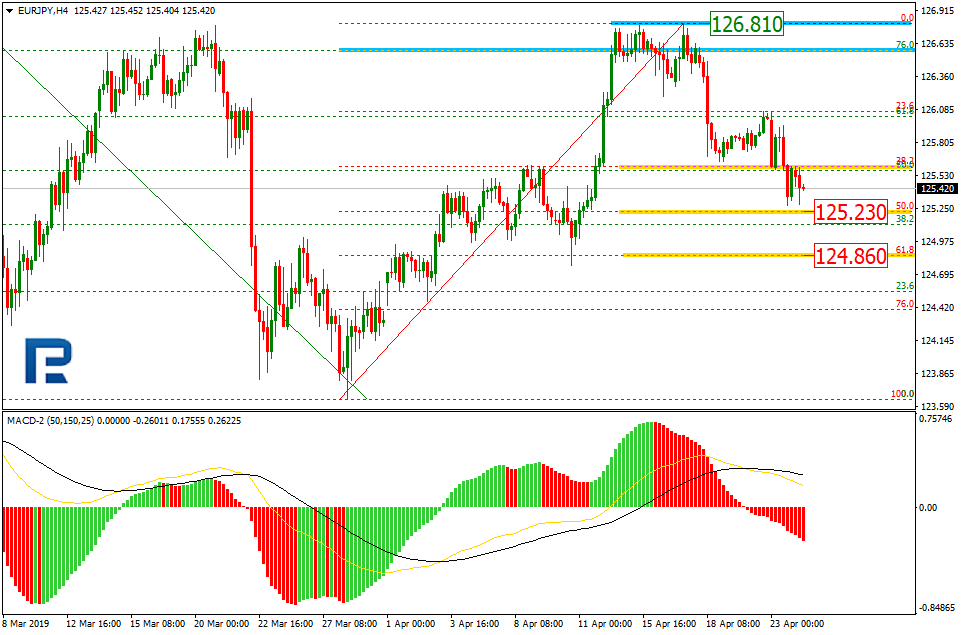
As we can see in the H4 chart, after being corrected to the upside by 76.0%, EURJPY is trading downwards. The current descending correction is heading towards the retracements of 50.0% and 61.8% at 125.23 and 124.86 respectively. The resistance is the high at 126.81.
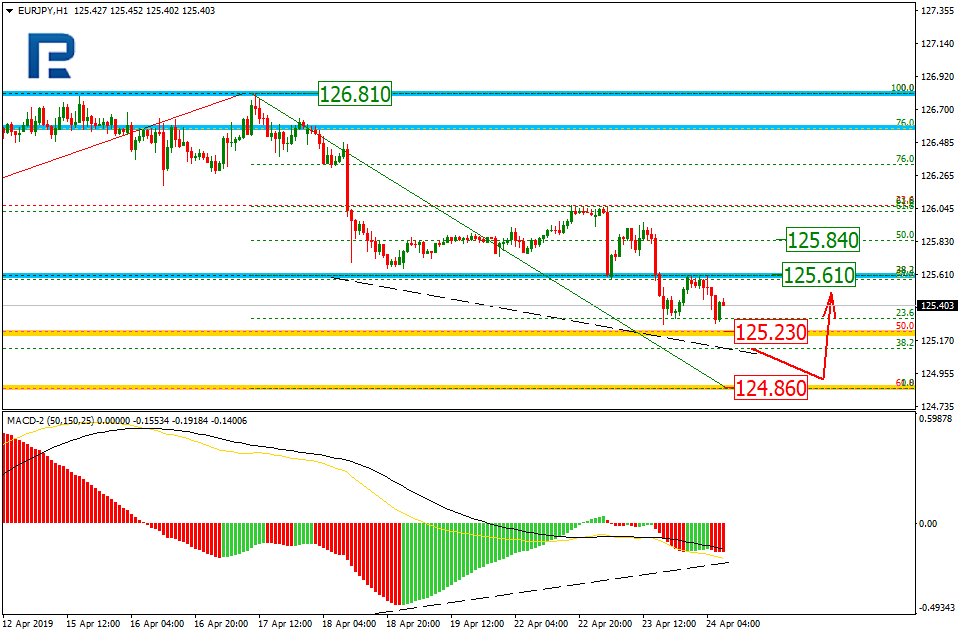
In the H1 chart, the pair is being corrected downwards. At the same time, there is a convergence on MACD, that’s why the pair is expected to start a new rising pullback towards the retracements of 38.2% and 50.0% at 125.61 and 125.84 respectively after it reaches 124.86.
Forecasts presented in this section only reflect the author’s private opinion and should not be considered as guidance for trading. RoboForex bears no responsibility for trading results based on trading recommendations described in these analytical reviews.