Fibonacci Retracements Analysis 24.12.2019 (EURUSD, USDJPY)
EURUSD, “Euro vs US Dollar”
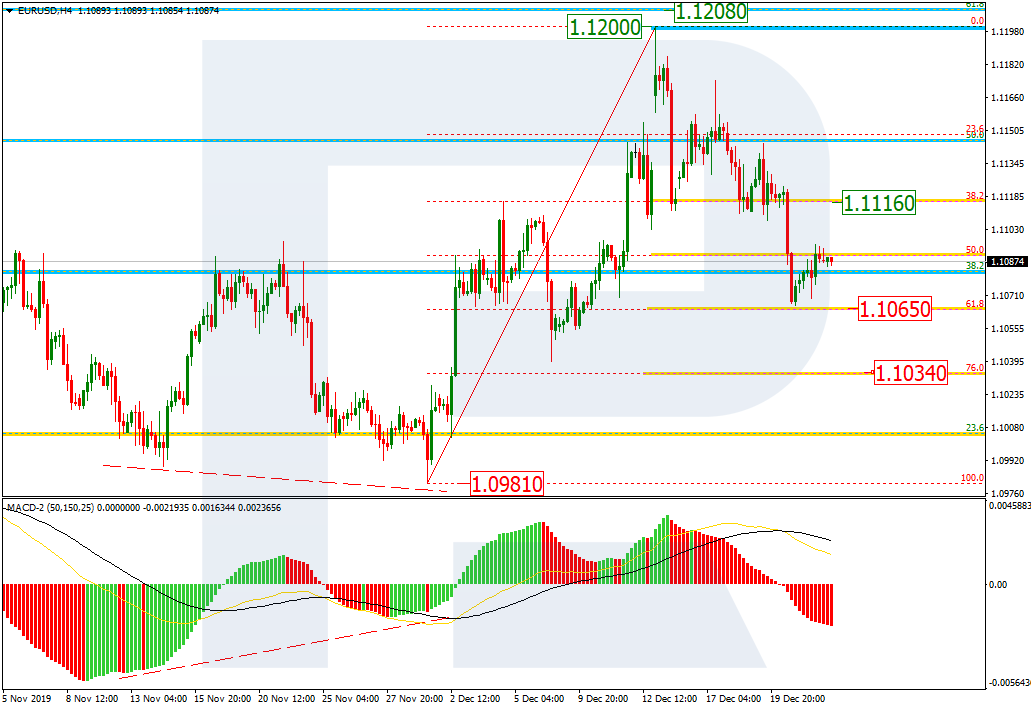
As we can see in the H4 chart, the correctional downtrend has almost reached 61.8% fibo at 1.1065 but is not in a hurry to continue. The next descending impulse may reach 61.8% and 76.0% fibo at 1.1065 and 1.1034 respectively, and if it later breaks the fractal support at 1.0981, the price may continue falling towards its long-term lows. The current resistance is 38.2% fibo at 1.1116. If EURUSD breaks it, the instrument may grow towards the high at 1.1200 and mid-term 61.8% fibo at 1.1208.

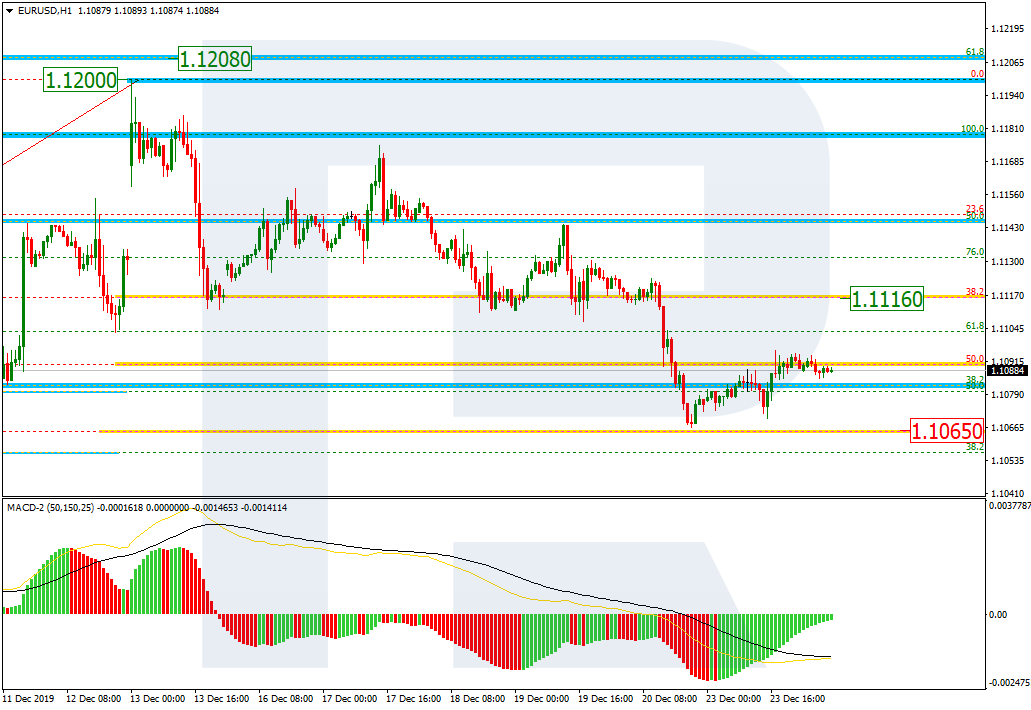
In the H1 chart, after trying to test 61.8% fibo, EURUSD started a new pullback. The target is the local resistance at 38.2% fibo at 1.1116.
USDJPY, “US Dollar vs. Japanese Yen”
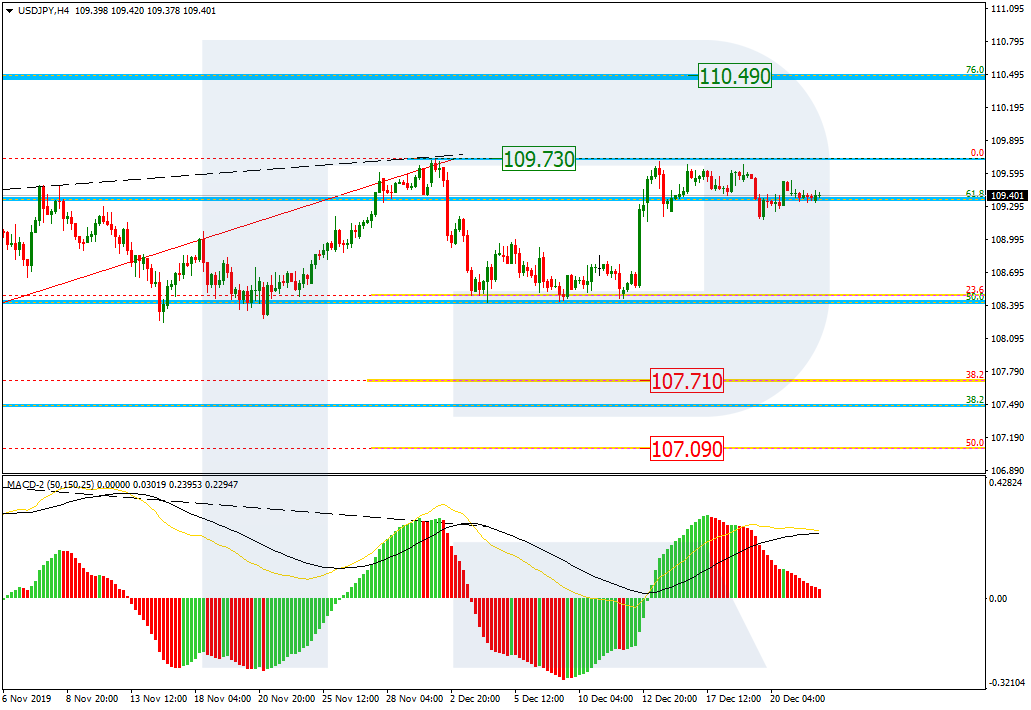
As we can see in the H4 chart, after rebounding from 23.6% fibo, USDJPY is trading near the high at 109.73. If the price breaks the high, the instrument may continue growing to reach 76.0% fibo at 110.49. Otherwise, USDJPY may continue its decline towards 38.2%, 50.0%, and 61.8% fibo at 107.71, 107.09, and 106.47 respectively.
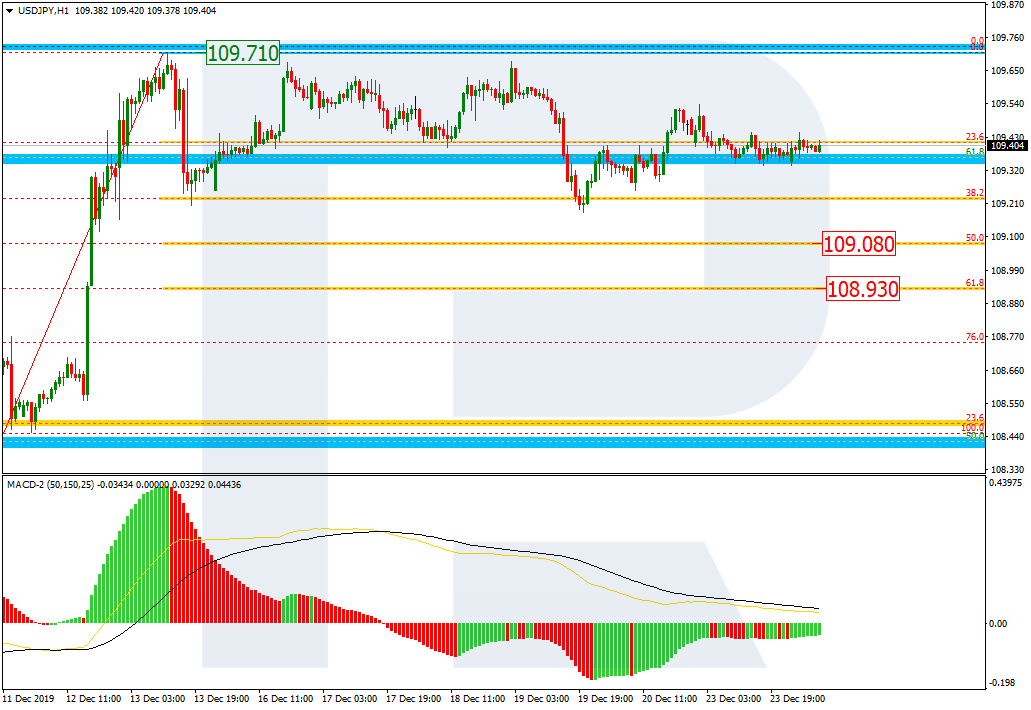
In the H1 chart, after completing the rising impulse, the pair is correcting downwards and has already reached 38.2% fibo. Possibly, later the price may continue trading towards 50.0 and 61.8% fibo at 109.08 and 108.93 respectively.
Forecasts presented in this section only reflect the author’s private opinion and should not be considered as guidance for trading. RoboForex bears no responsibility for trading results based on trading recommendations described in these analytical reviews.