Fibonacci Retracements Analysis 30.01.2020 (AUDUSD, USDCAD)
AUDUSD, “Australian Dollar vs US Dollar”
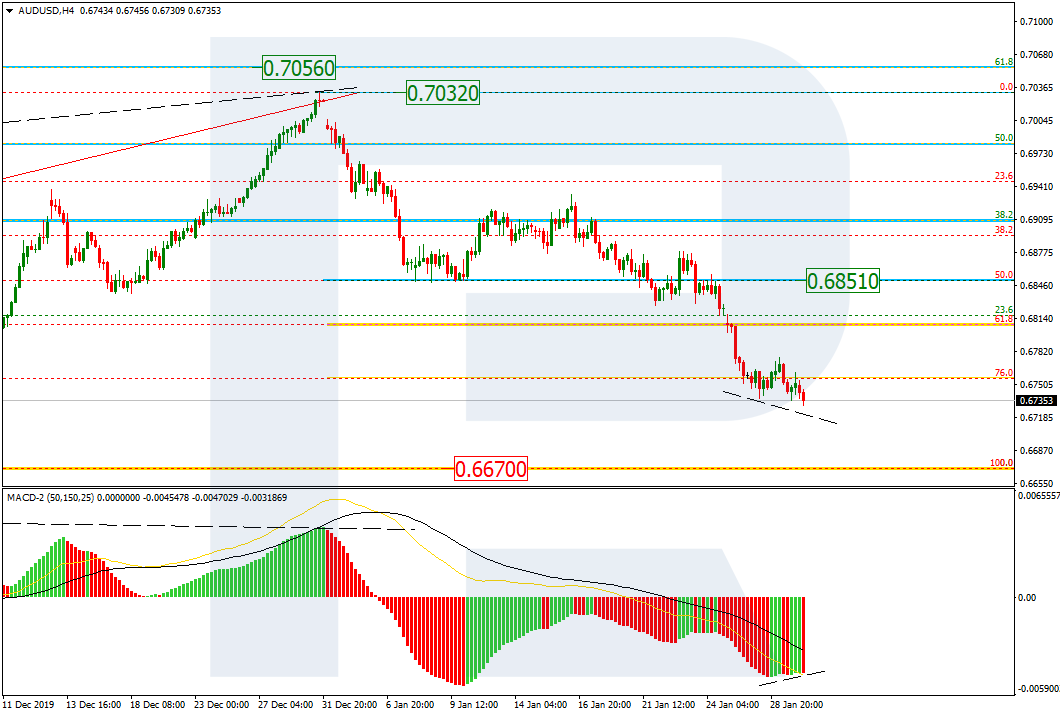
As we can see in the H4 chart, after testing 76.0% fibo, the pair continues the descending tendency towards the long-term low at 0.6670. At the same time, there is a convergence on MACD, which may indicate a possible pullback after the price reaches its target. The resistance is at 50.0% fibo (0.6851).

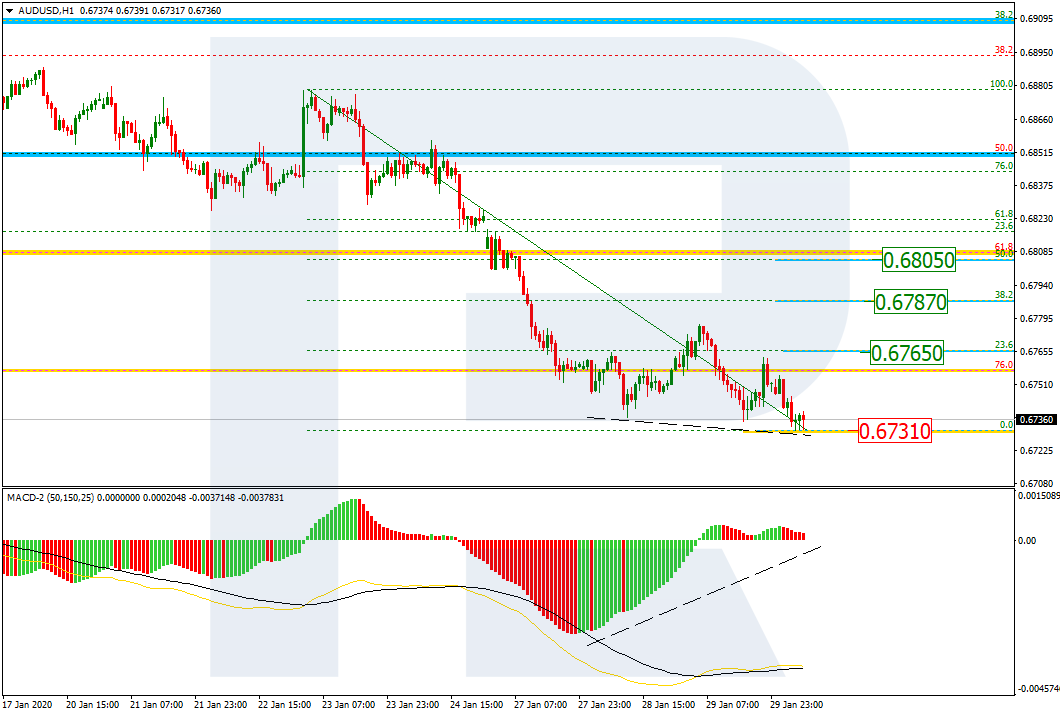
The H1 chart shows that the convergence on MACD is slowing down the current descending movement in favor of a new short-term pullback. The correctional targets may be 23.6%, 38.2%, and 50.0% fibo at 0.6765, 0.6787, and 0.6805 respectively. The support is the low at 0.6731.
USDCAD, “US Dollar vs Canadian Dollar”
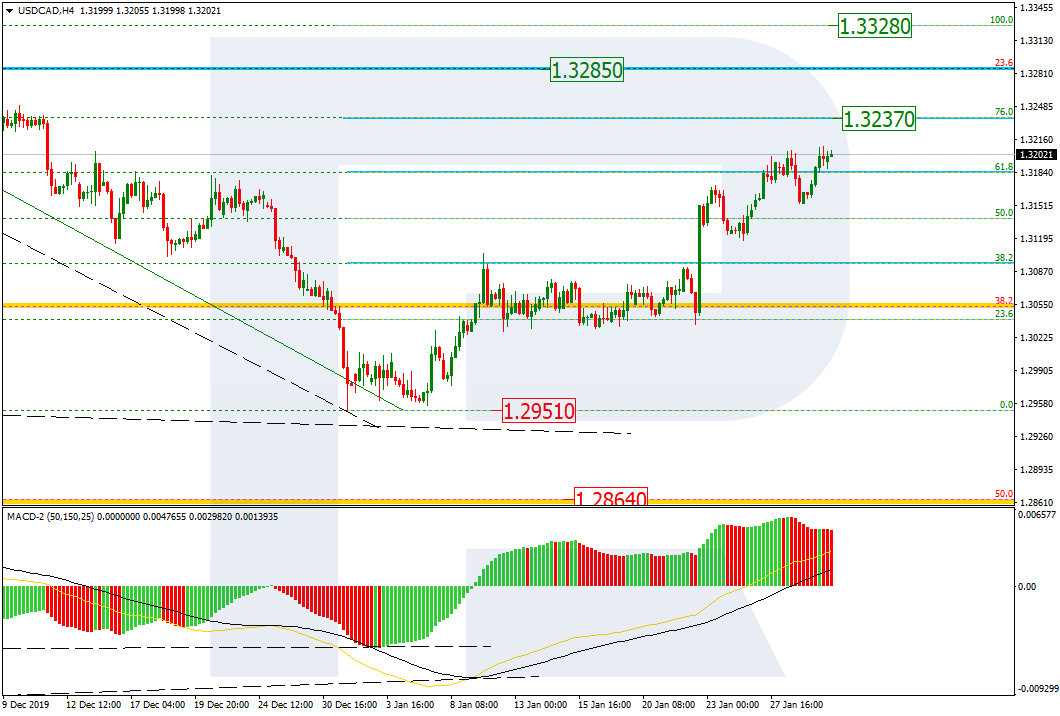
As we can see in the H4 chart, USDCAD continues growing slowly towards 76.0% fibo at 1.3237. After breaking this level and fixing above it, the instrument may continue trading downwards to reach the fractal high at 1.3328.
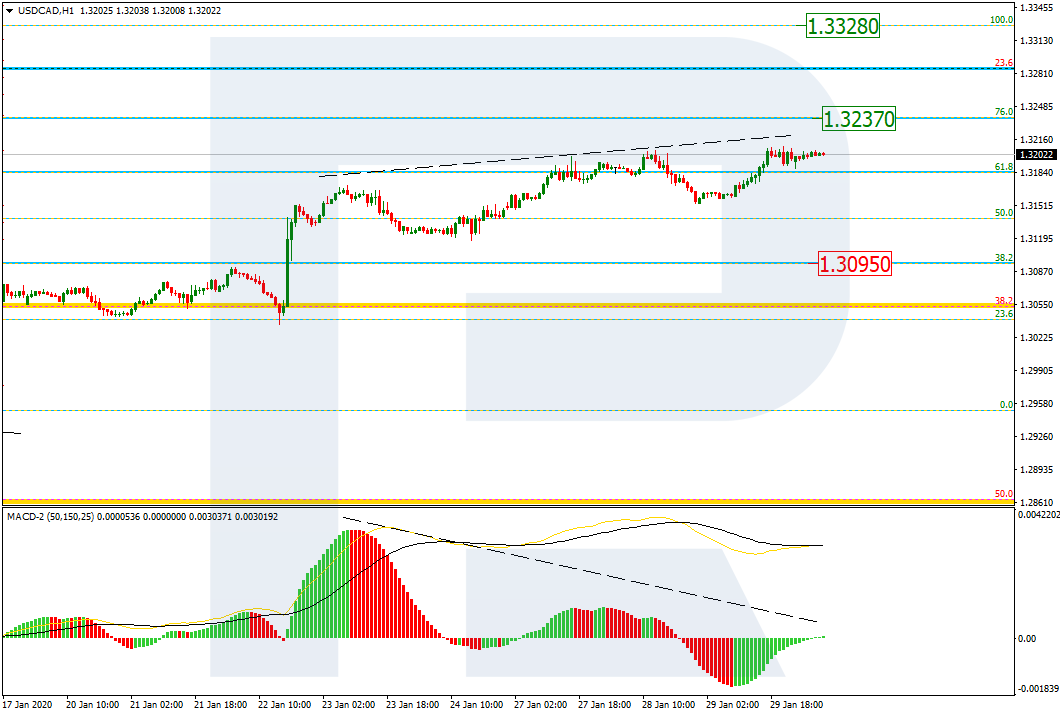
The H1 chart shows more detailed structure of the current growth towards 76.0% fibo at 1.3237. The growth is slowing down and there is a divergence on MACD, which may indicate a new pullback towards the support at 38.2% fibo at 1.3095 after the instrument reaches its target.
Forecasts presented in this section only reflect the author’s private opinion and should not be considered as guidance for trading. RoboForex bears no responsibility for trading results based on trading recommendations described in these analytical reviews.