Murrey Math Lines 02.09.2022 (Brent, S&P 500)
Brent
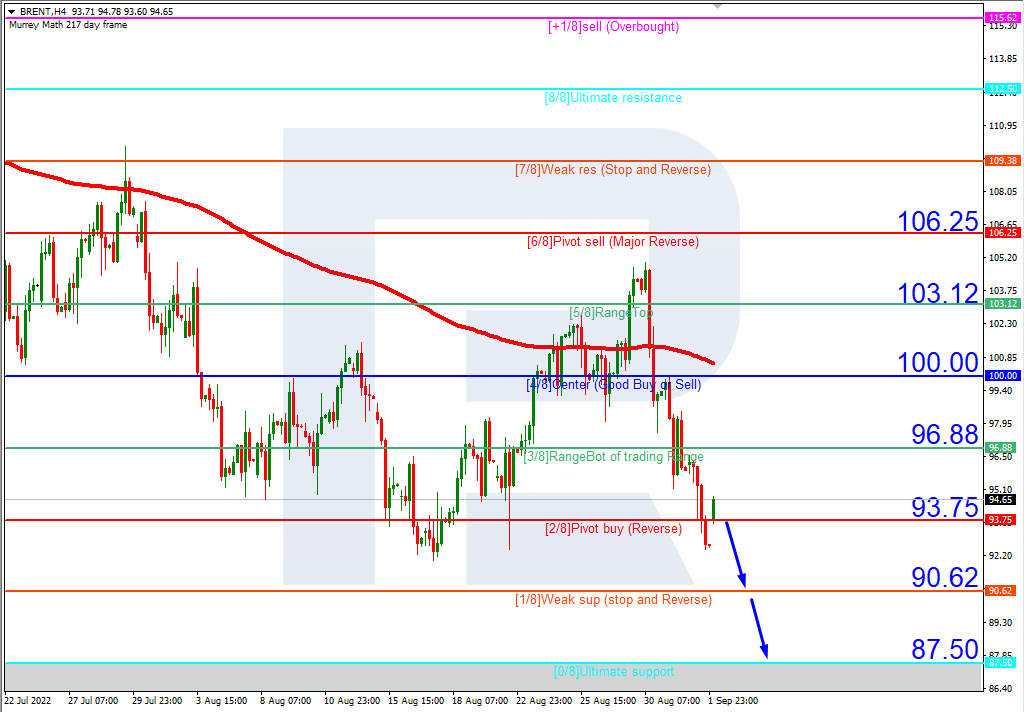
In the H4 chart, Brent is trading below the 200-day Moving Average, thus indicating a descending tendency. In this case, the price is expected to break 2/8 and continue moving downwards to reach the support at 0/8. However, this scenario may no longer be valid if the asset breaks 3/8 to the upside. After that, the instrument may reverse and grow towards the resistance at 4/8.

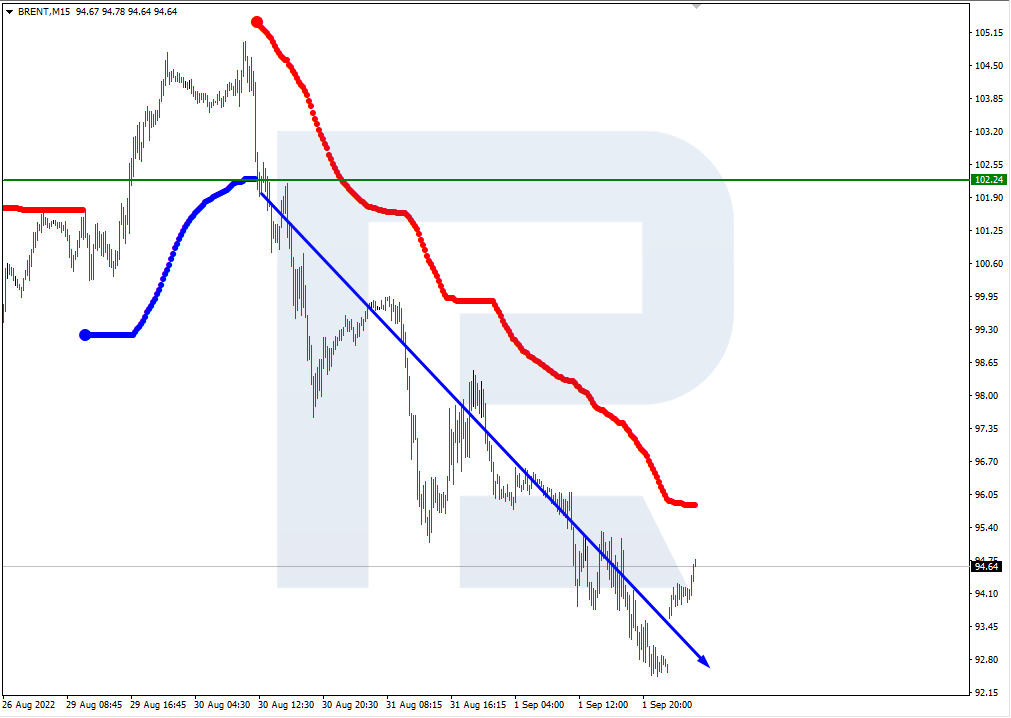
As we can see in the M15 chart, the pair has broken the downside line of the VoltyChannel indicator and, as a result, may continue its decline.
S&P 500
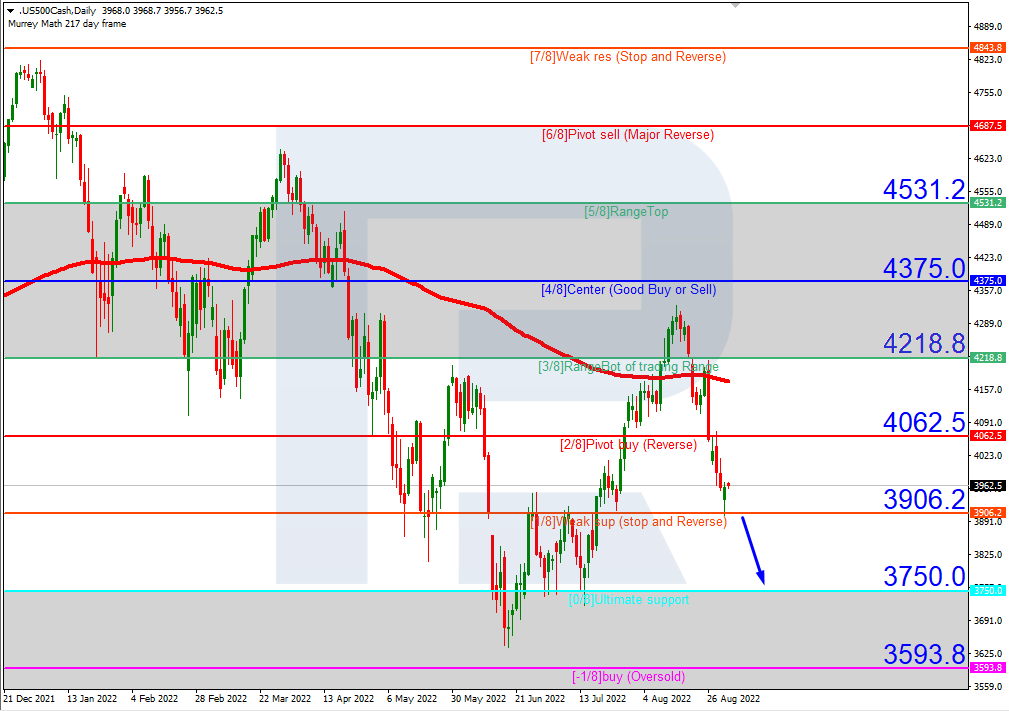
In the H4 chart, the S&P Index is also trading below the 200-day Moving Average to indicate a possible descending tendency. In this case, the price is expected to break 2/8 and continue falling towards the support at 0/8. However, this scenario may no longer be valid if the asset breaks the resistance at 2/8 to the upside. After that, the instrument may reverse and grow to reach 3/8.
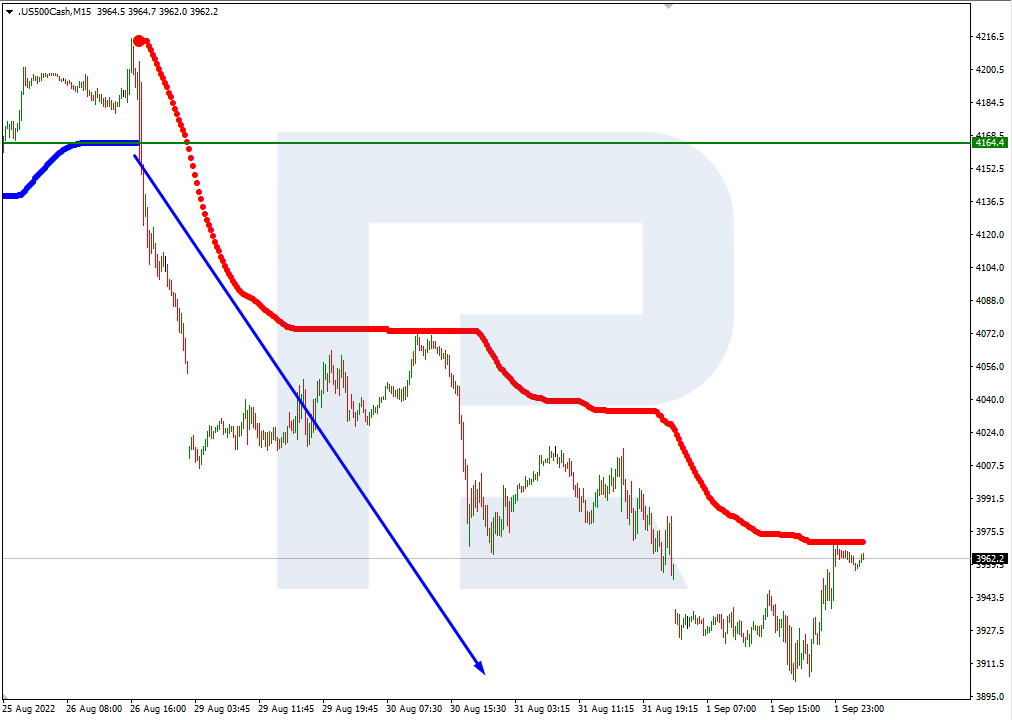
As we can see in the M15 chart, the pair has broken the downside line of the VoltyChannel indicator and, as a result, may continue trading downwards.
Forecasts presented in this section only reflect the author’s private opinion and should not be considered as guidance for trading. RoboForex bears no responsibility for trading results based on trading recommendations described in these analytical reviews.